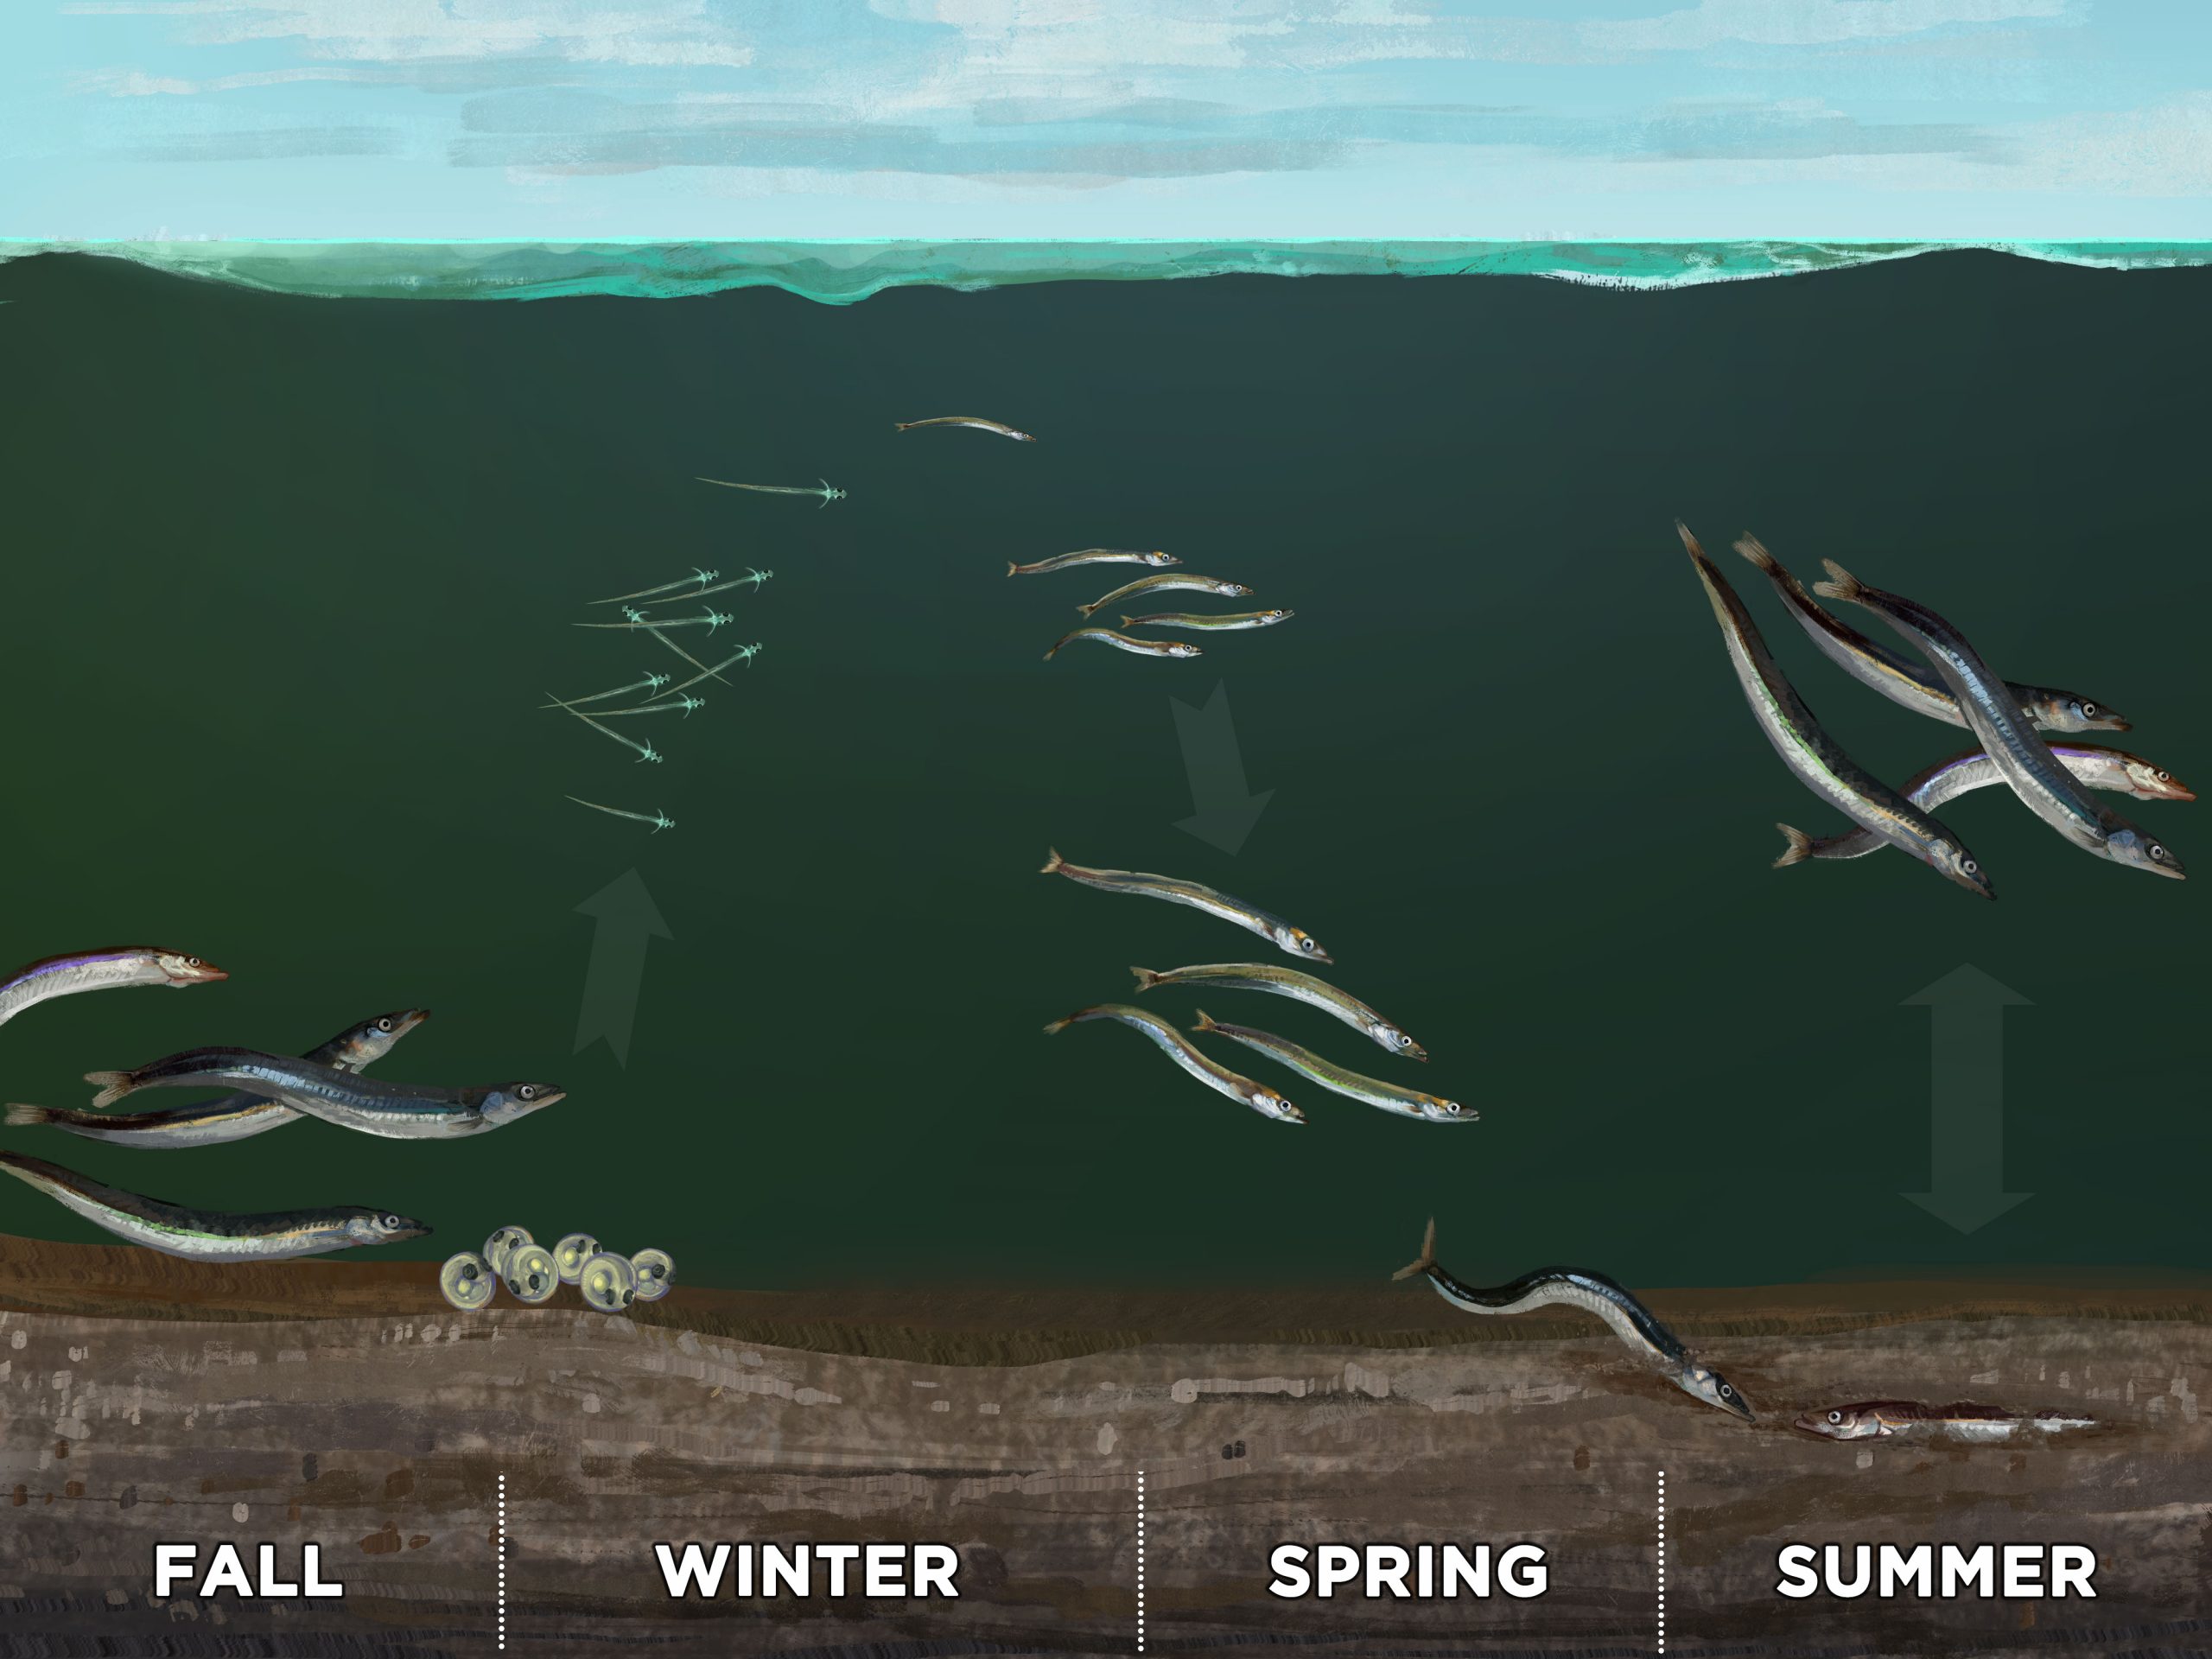
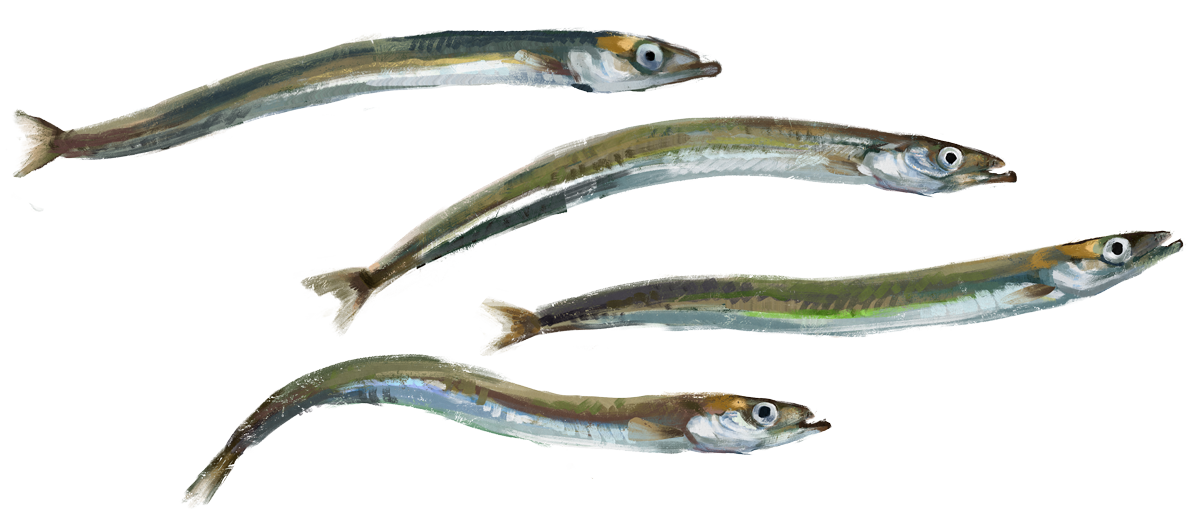
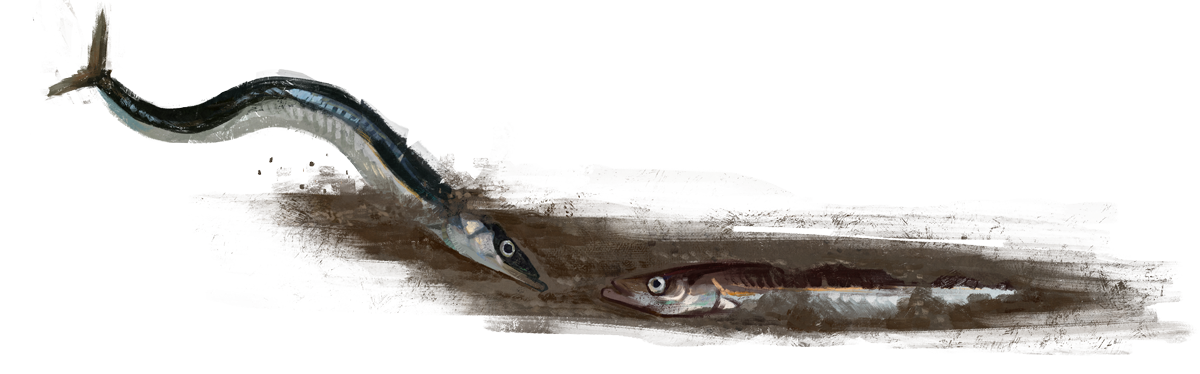
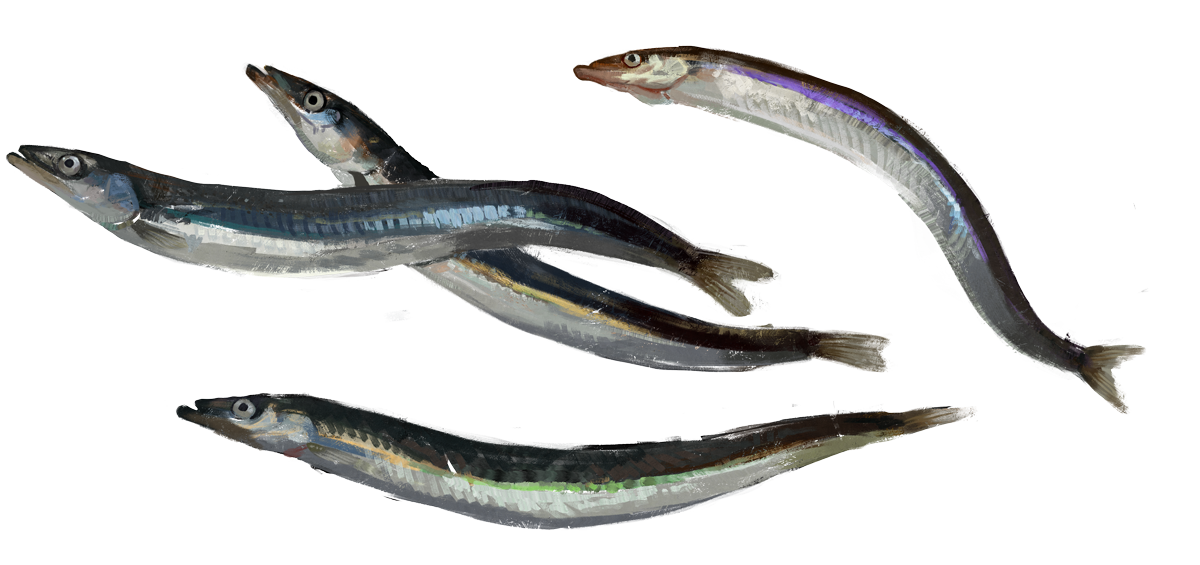
42. Life cycle of sand lance - line art by Elizabeth Estrada
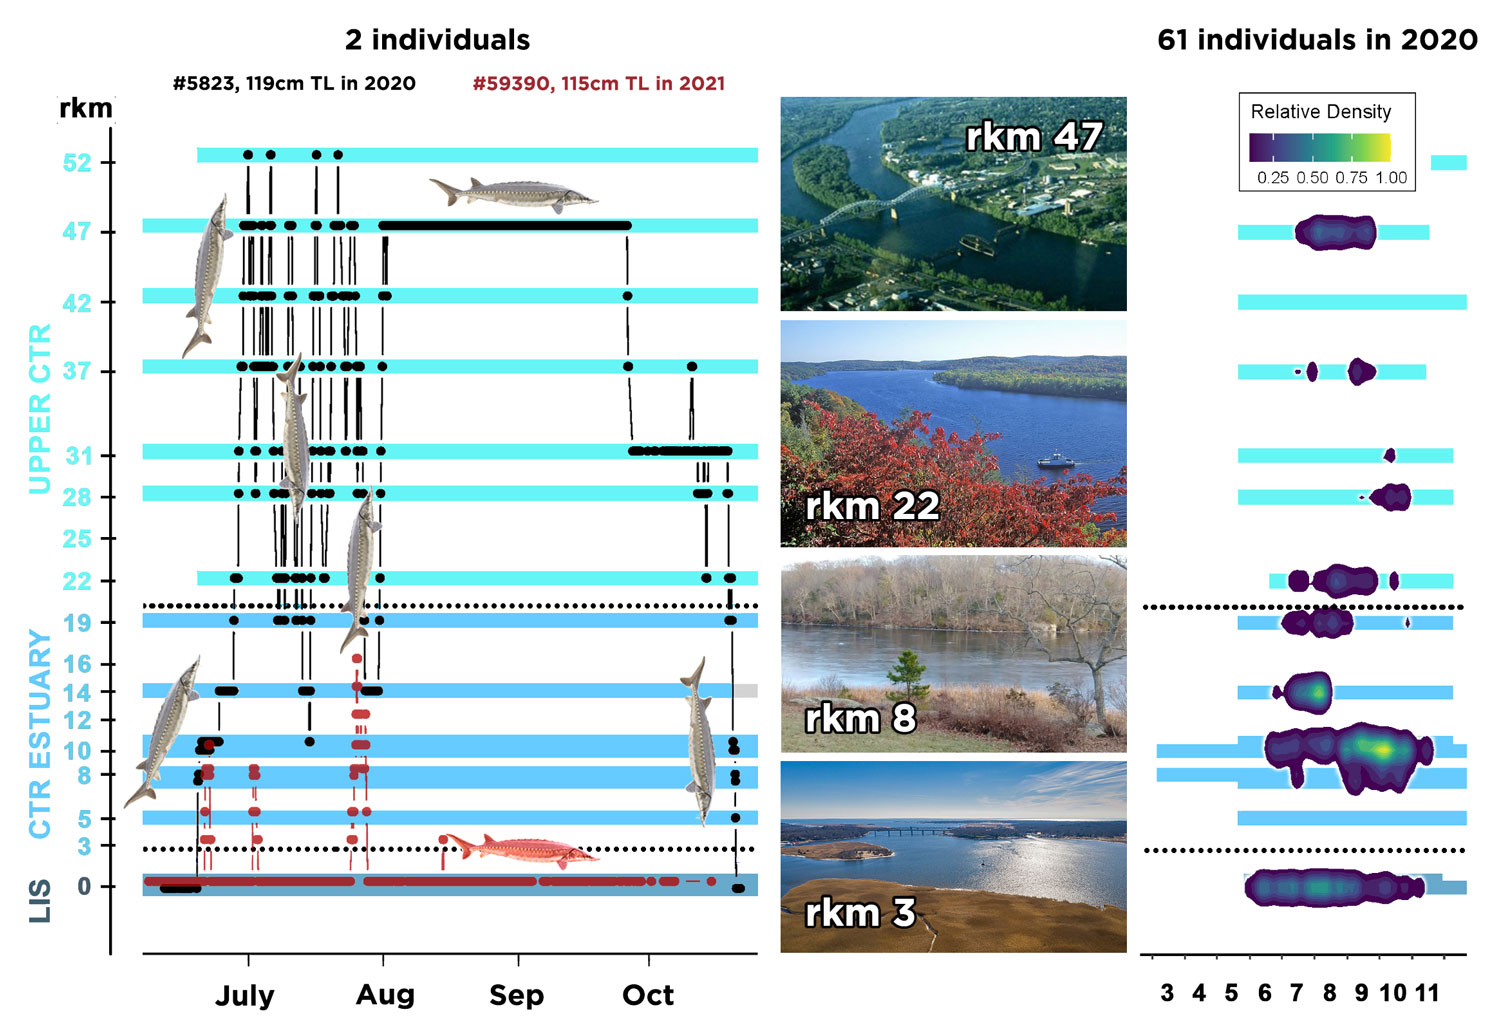
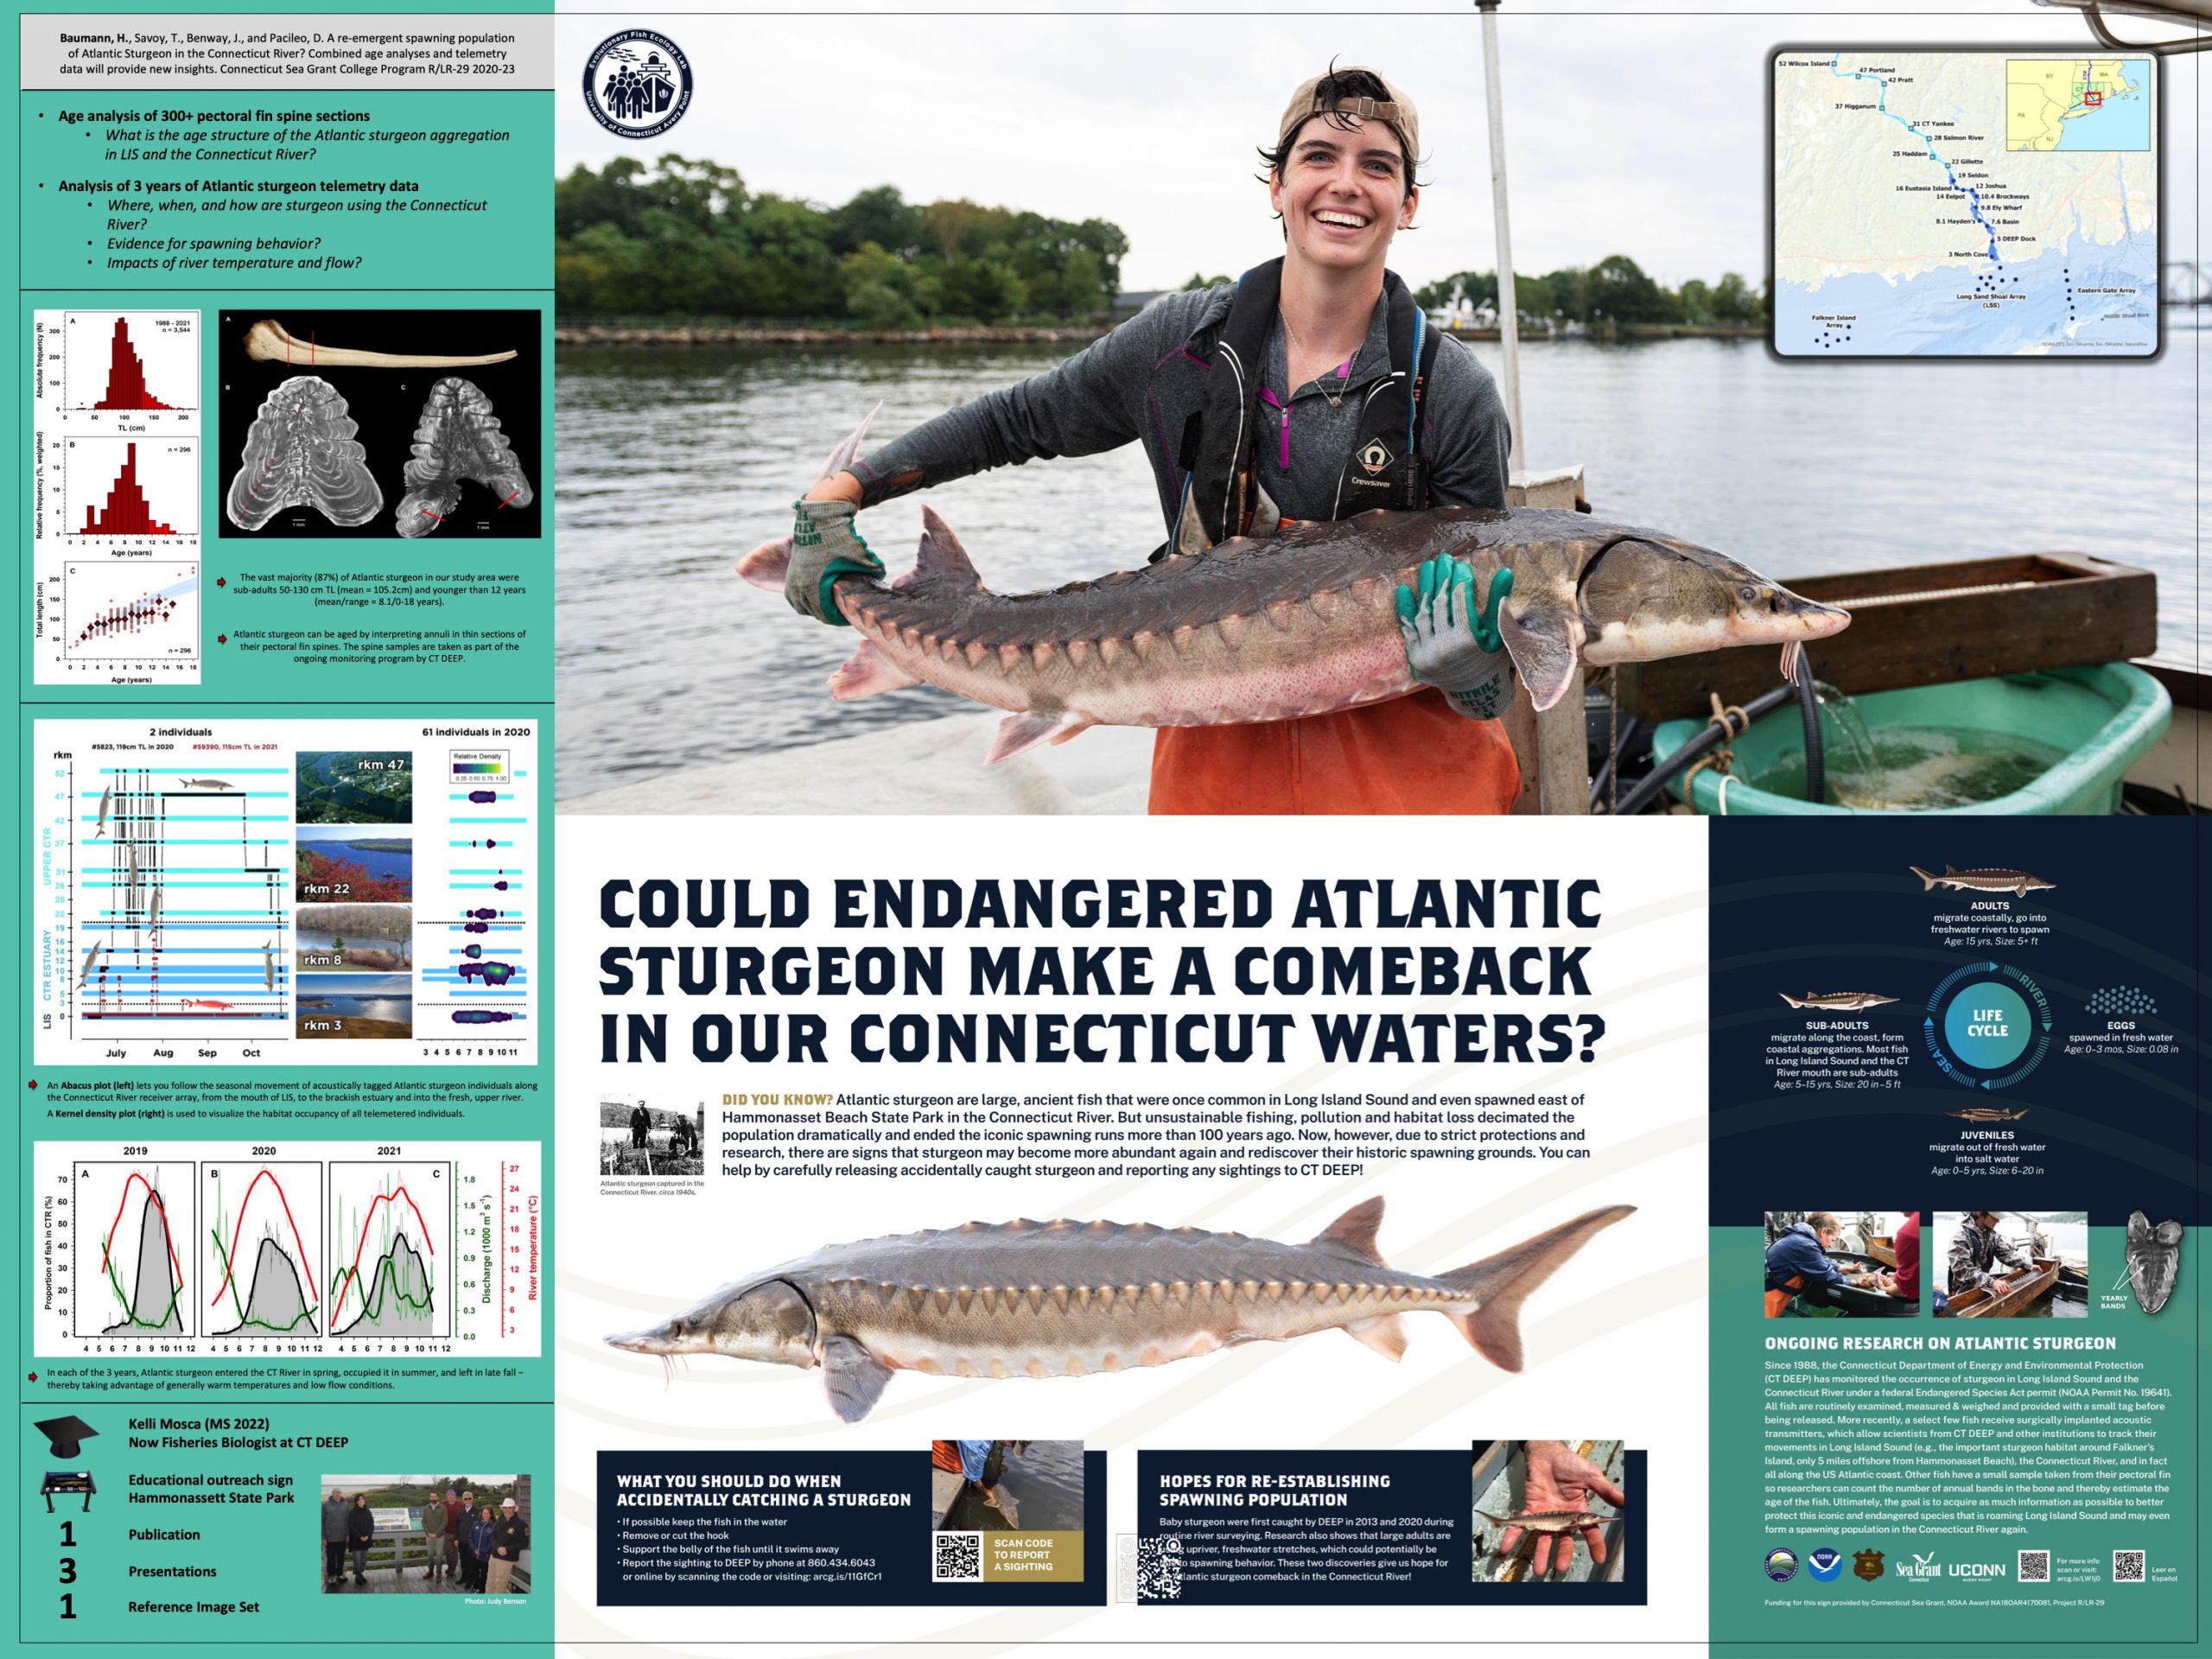
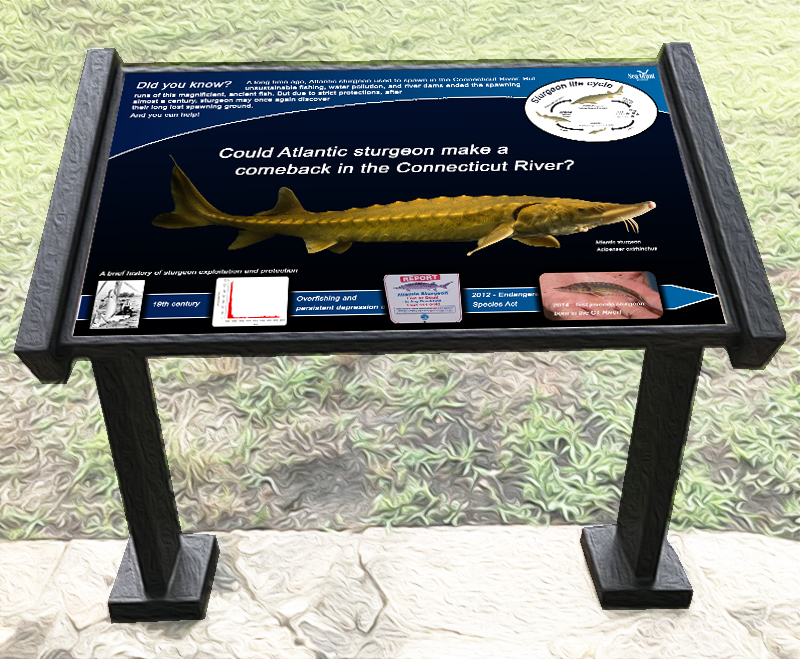
40. What are Atlantic sturgeon doing in the Connecticut River?
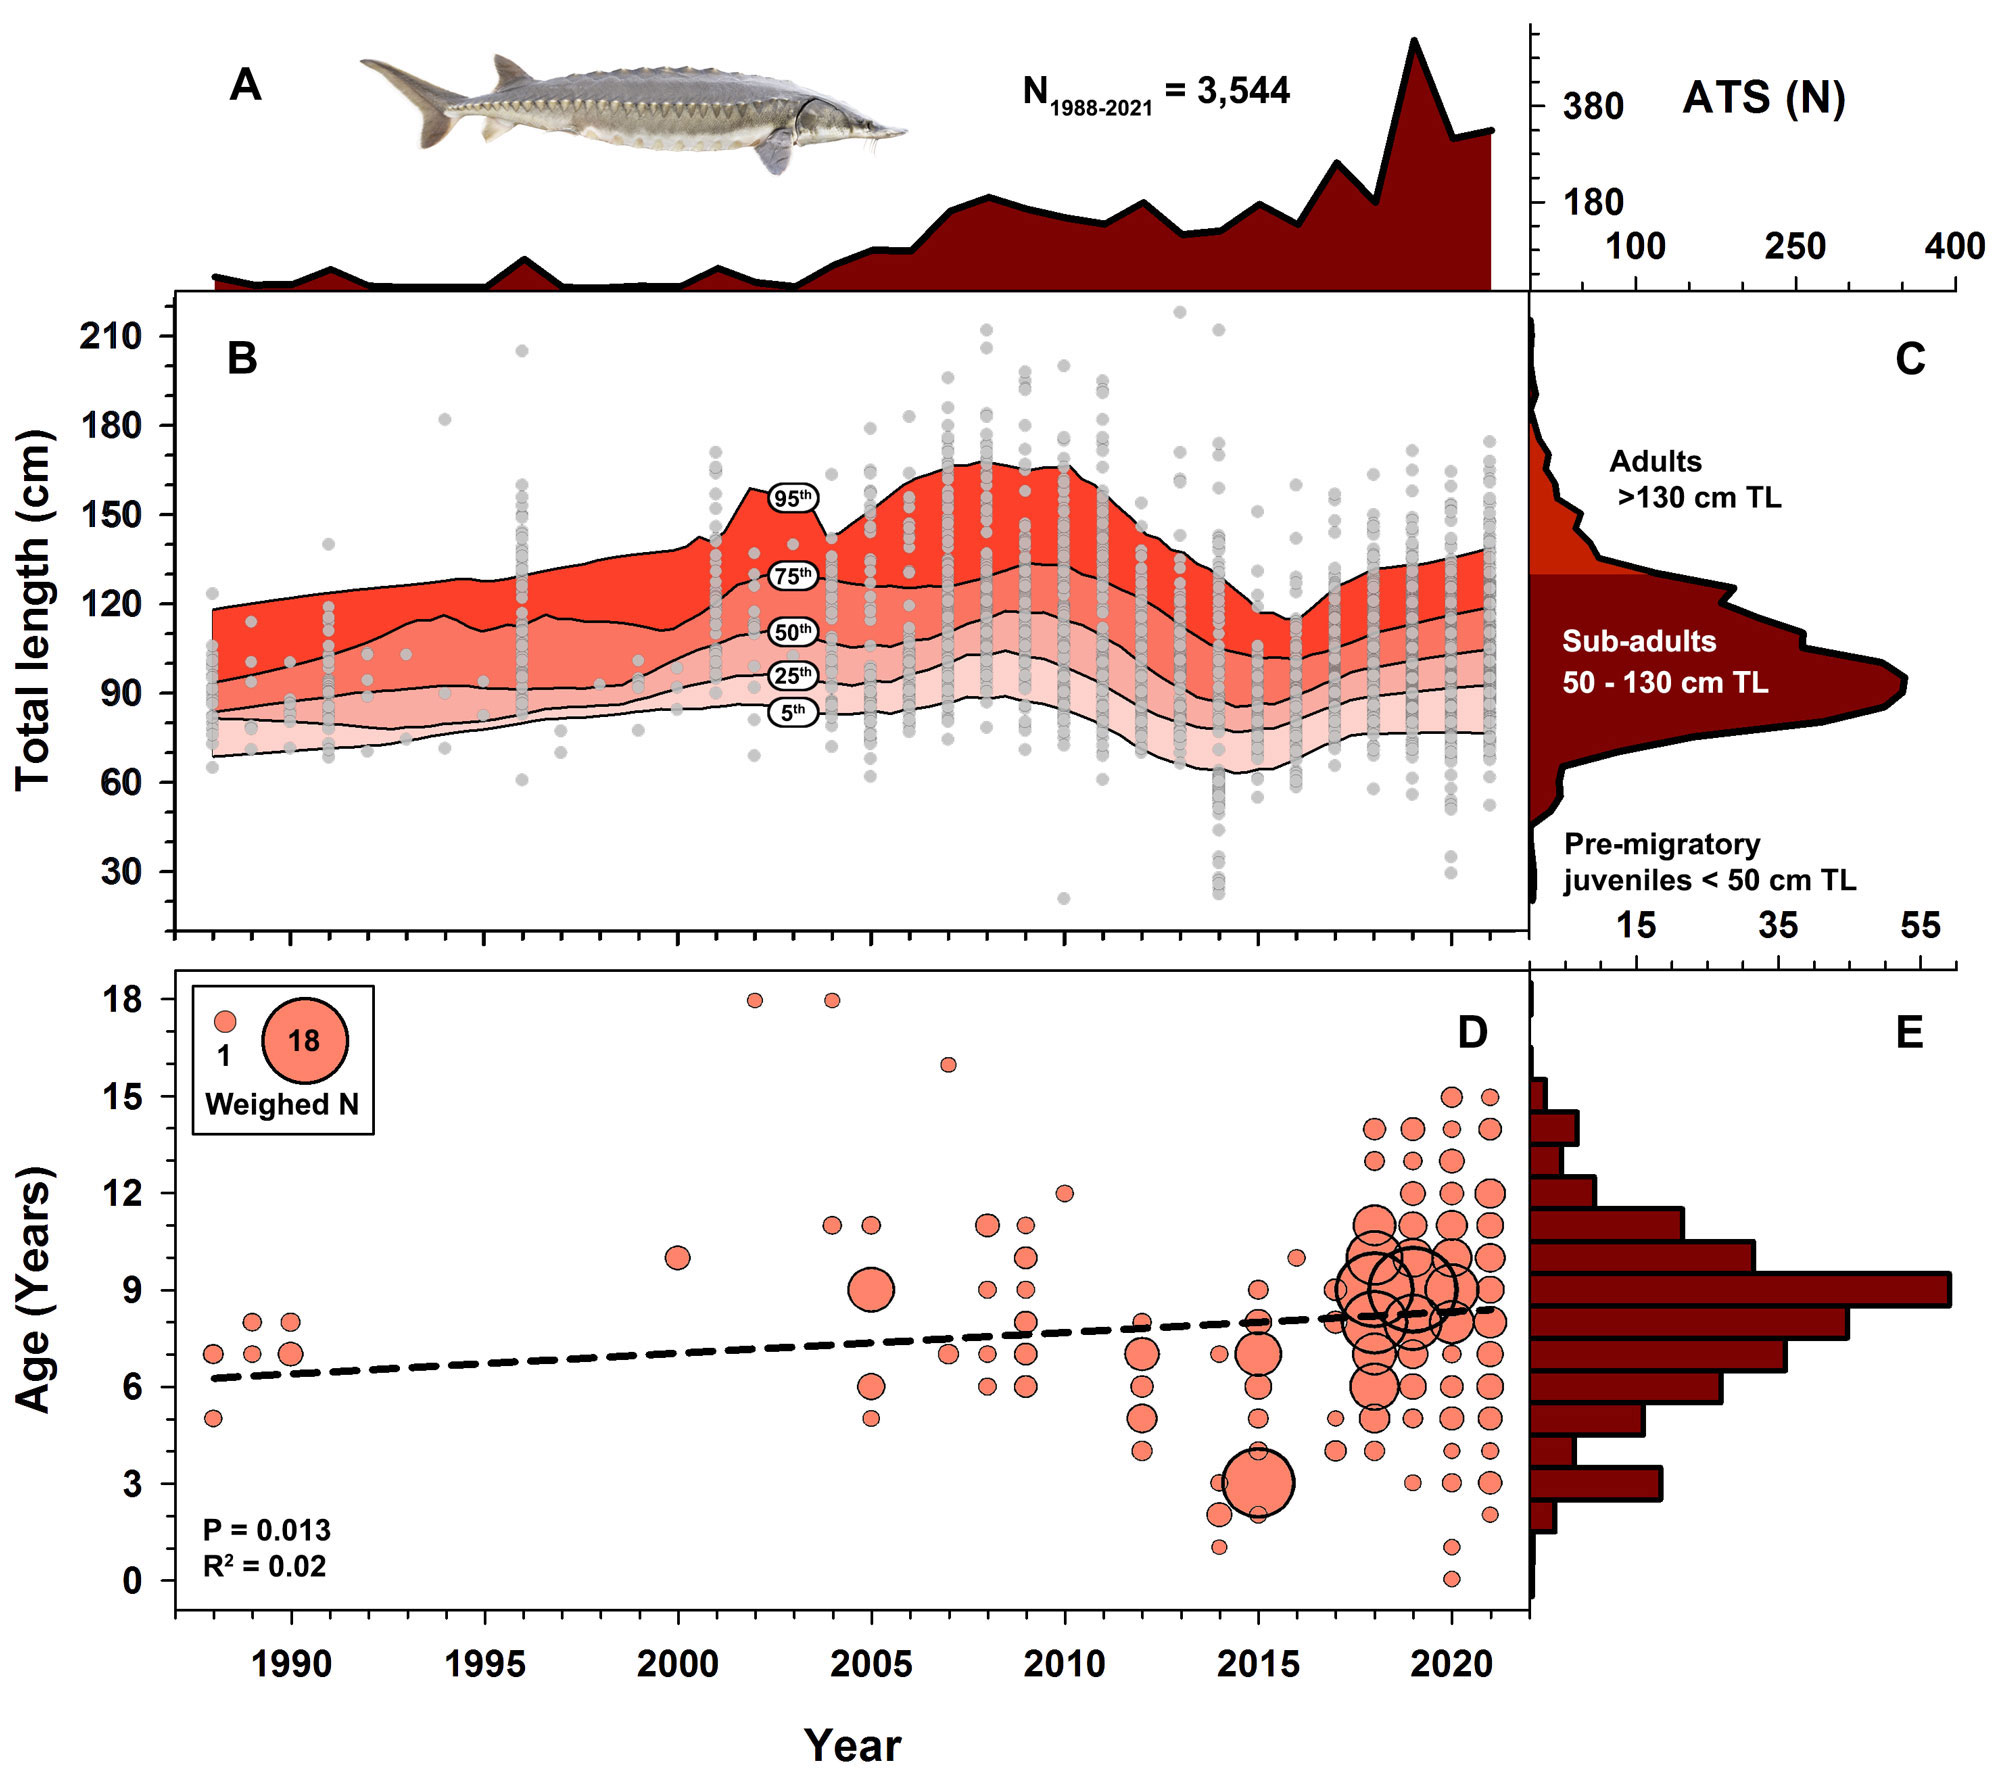
39. Atlantic sturgeon size and age distributions
37. Atlantic sturgeon in Long Island Sound and the Connecticut River
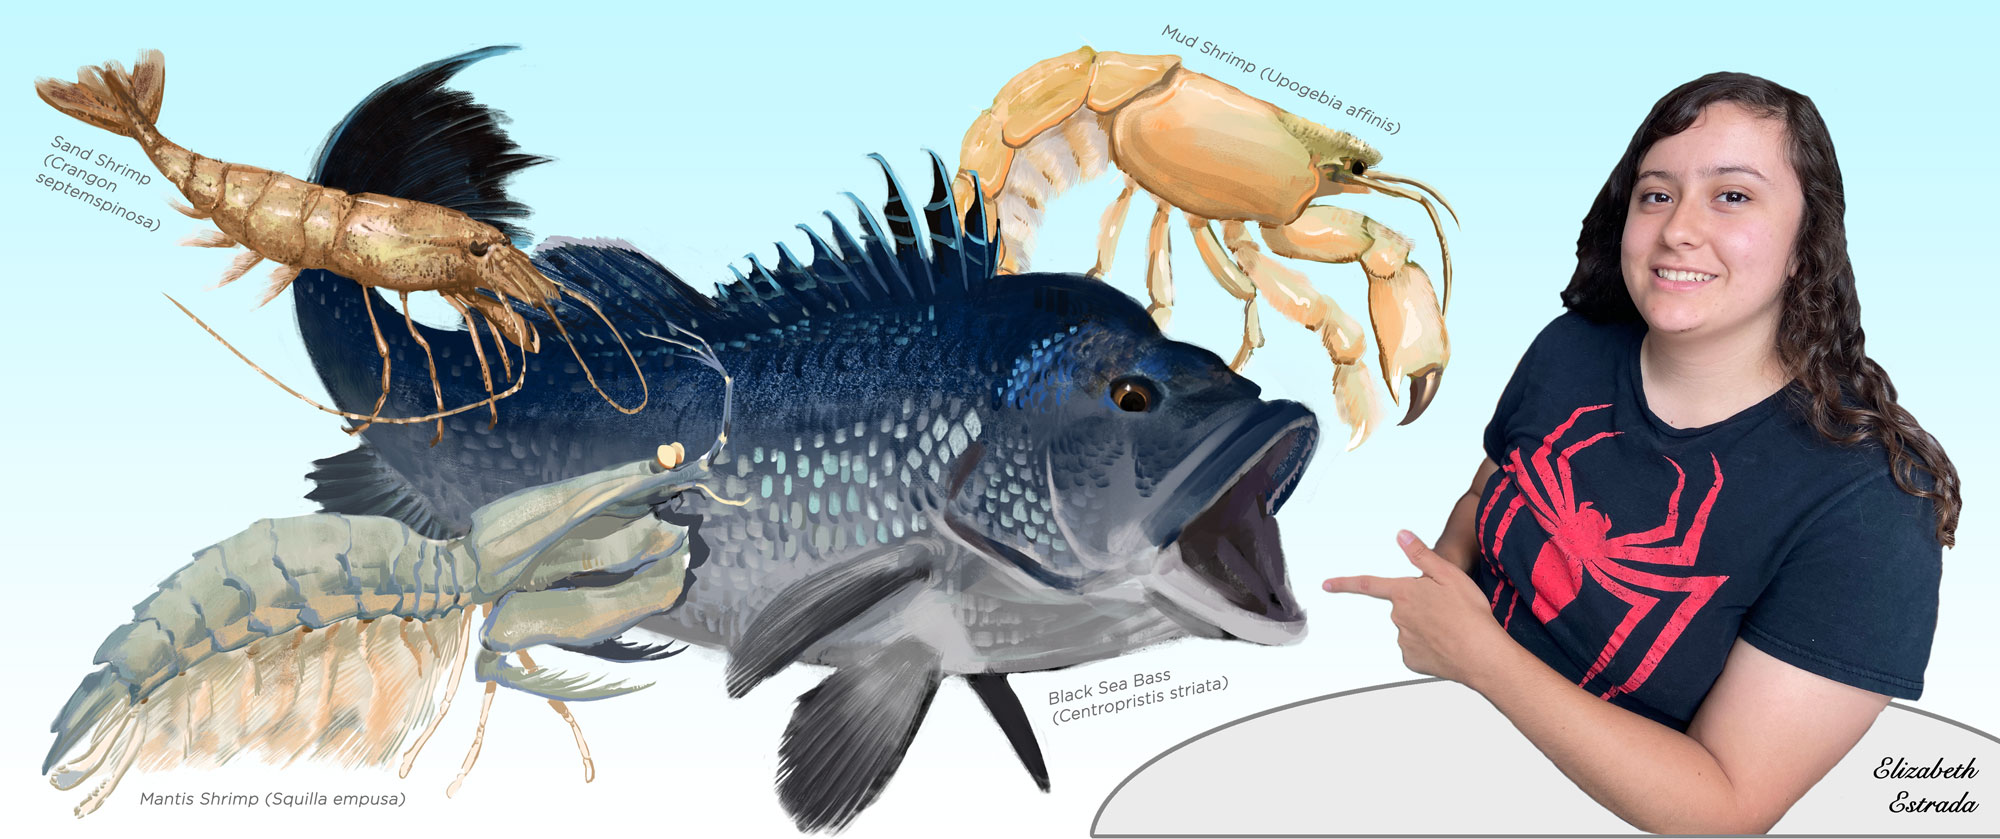
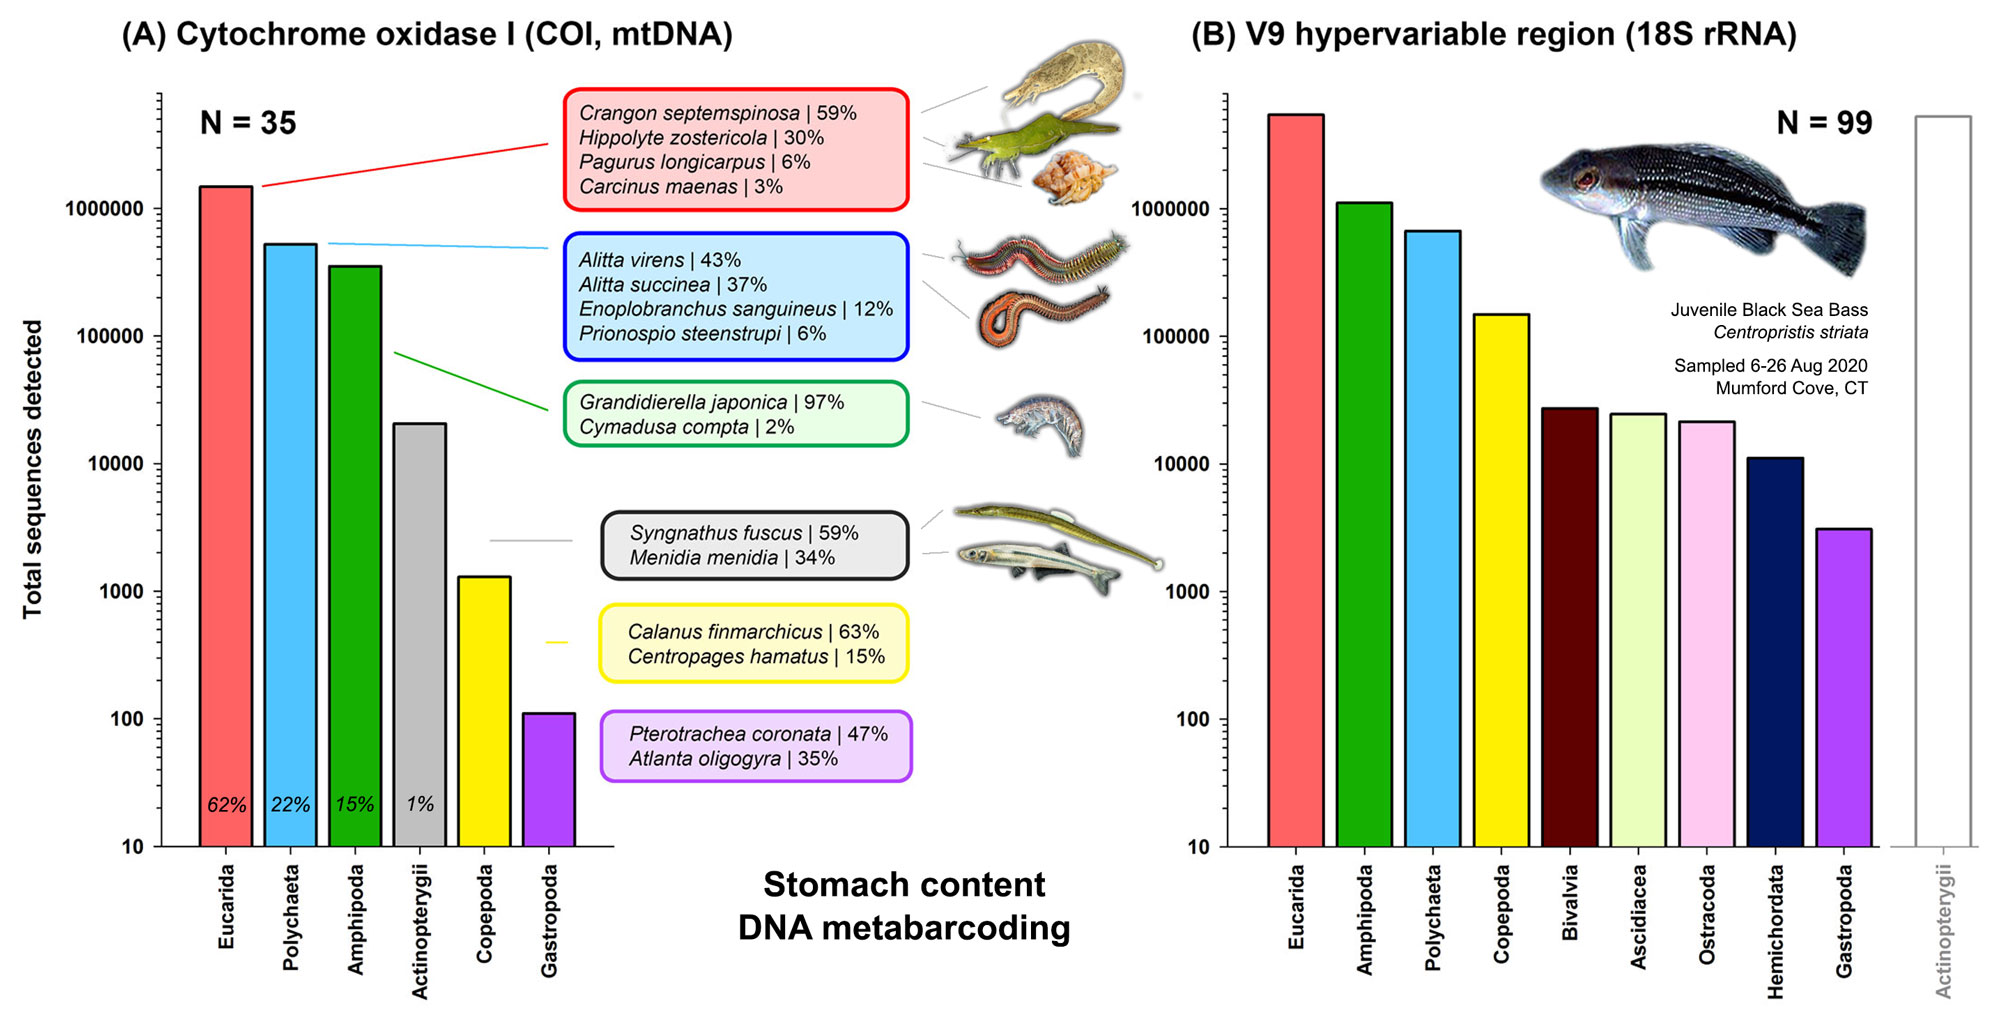
36. Metabarcoding of juvenile black sea bass stomach contents
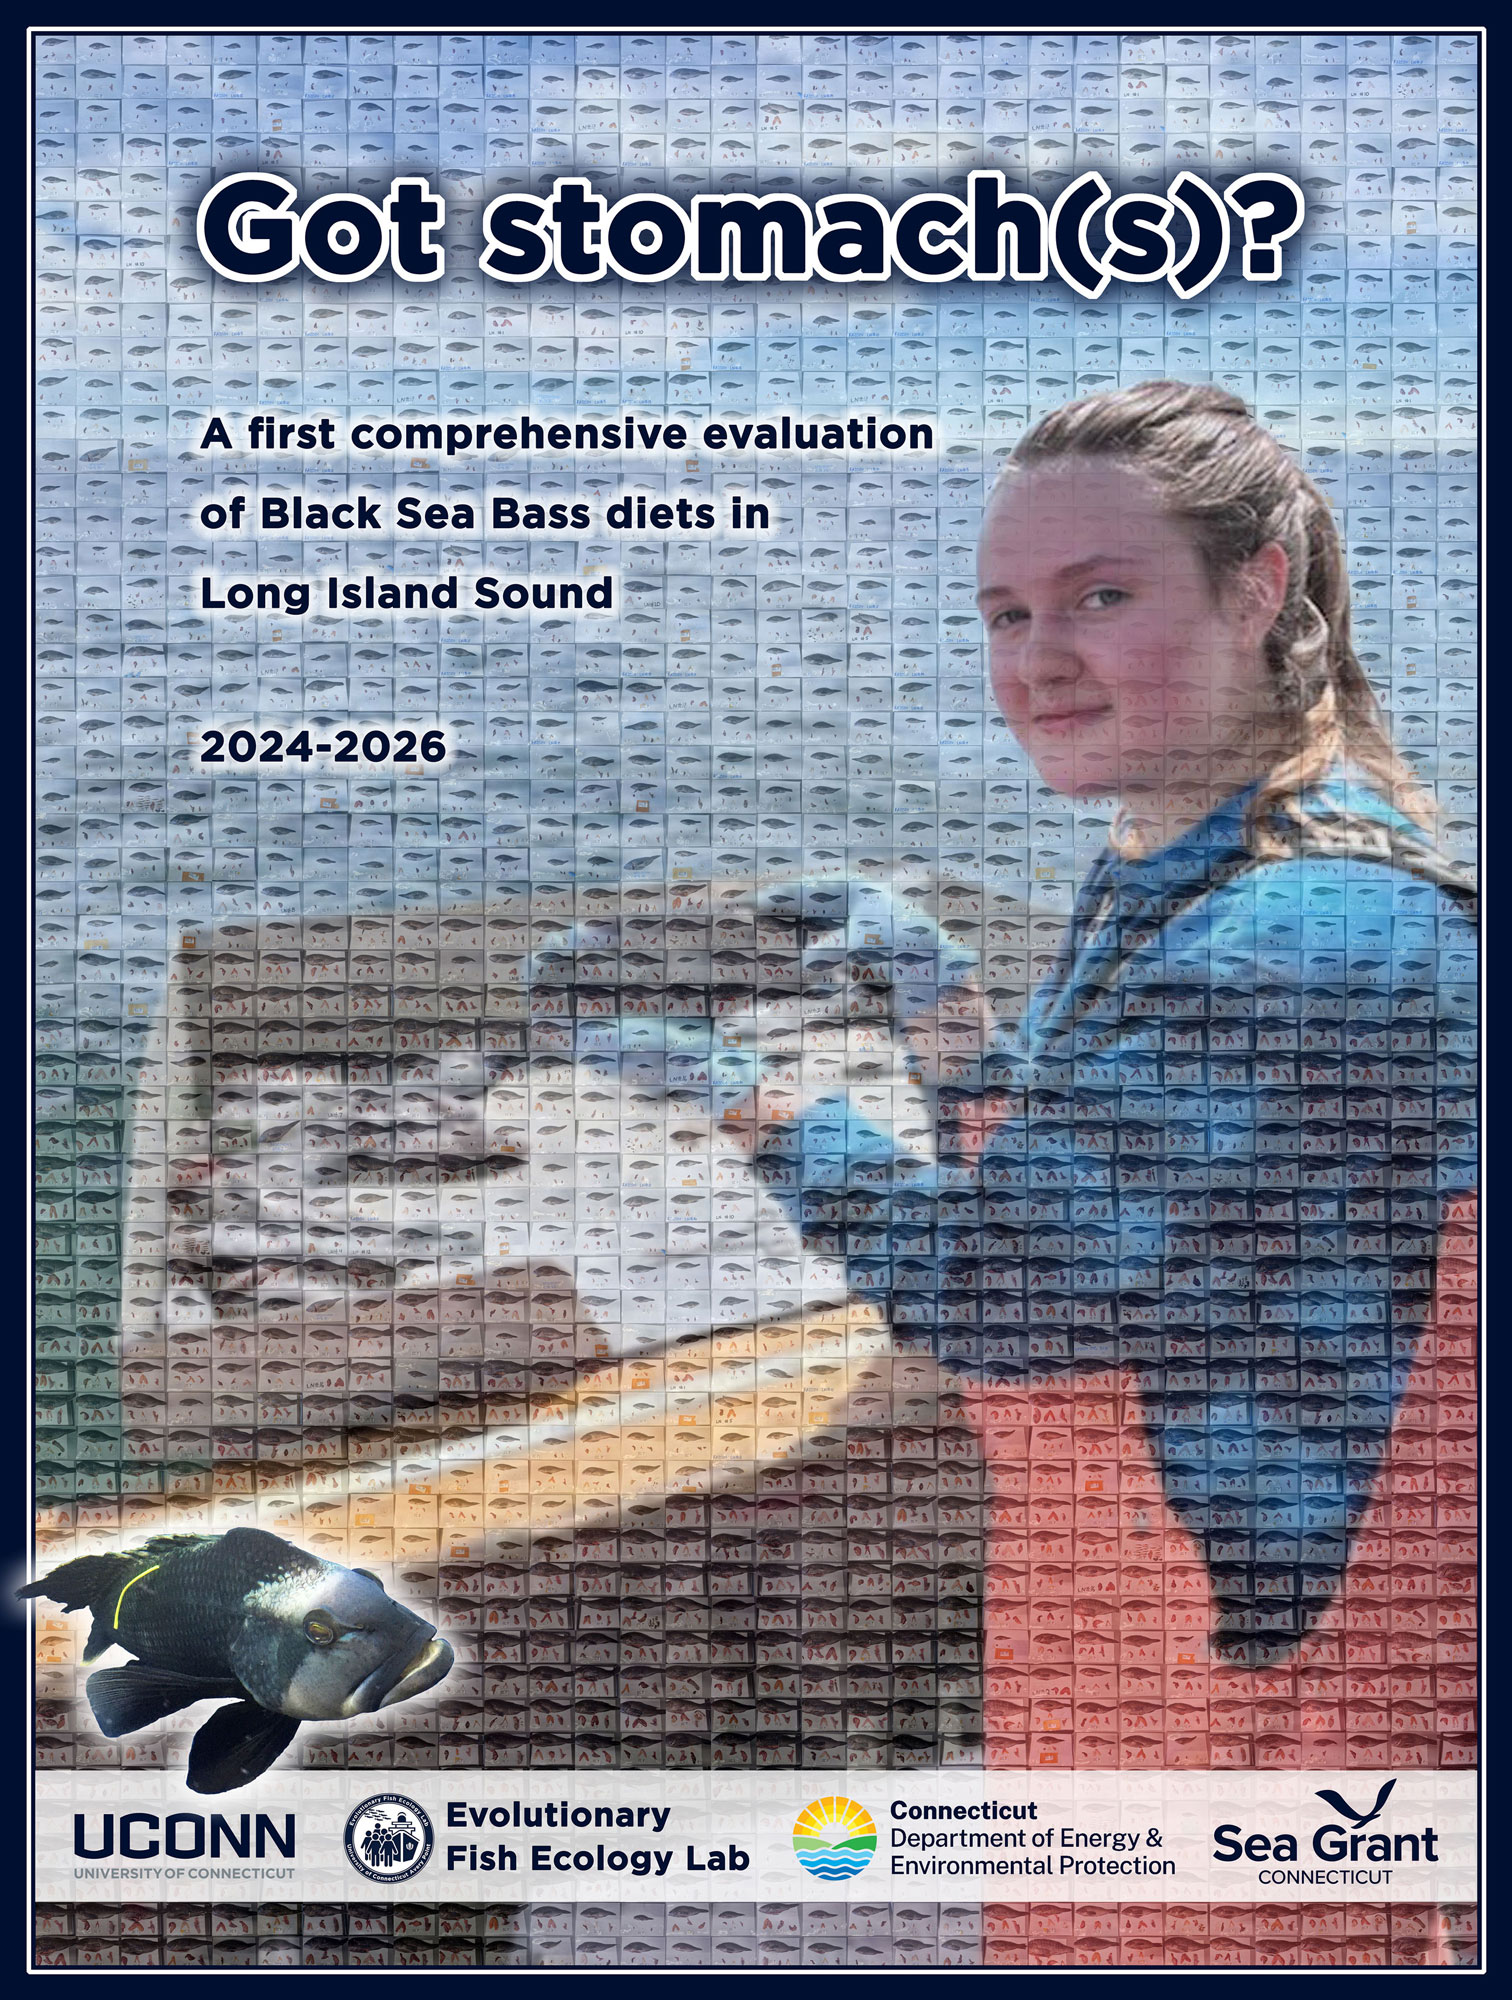
35. Got stomach(s)? Mosaic art of the black sea bass stomach project
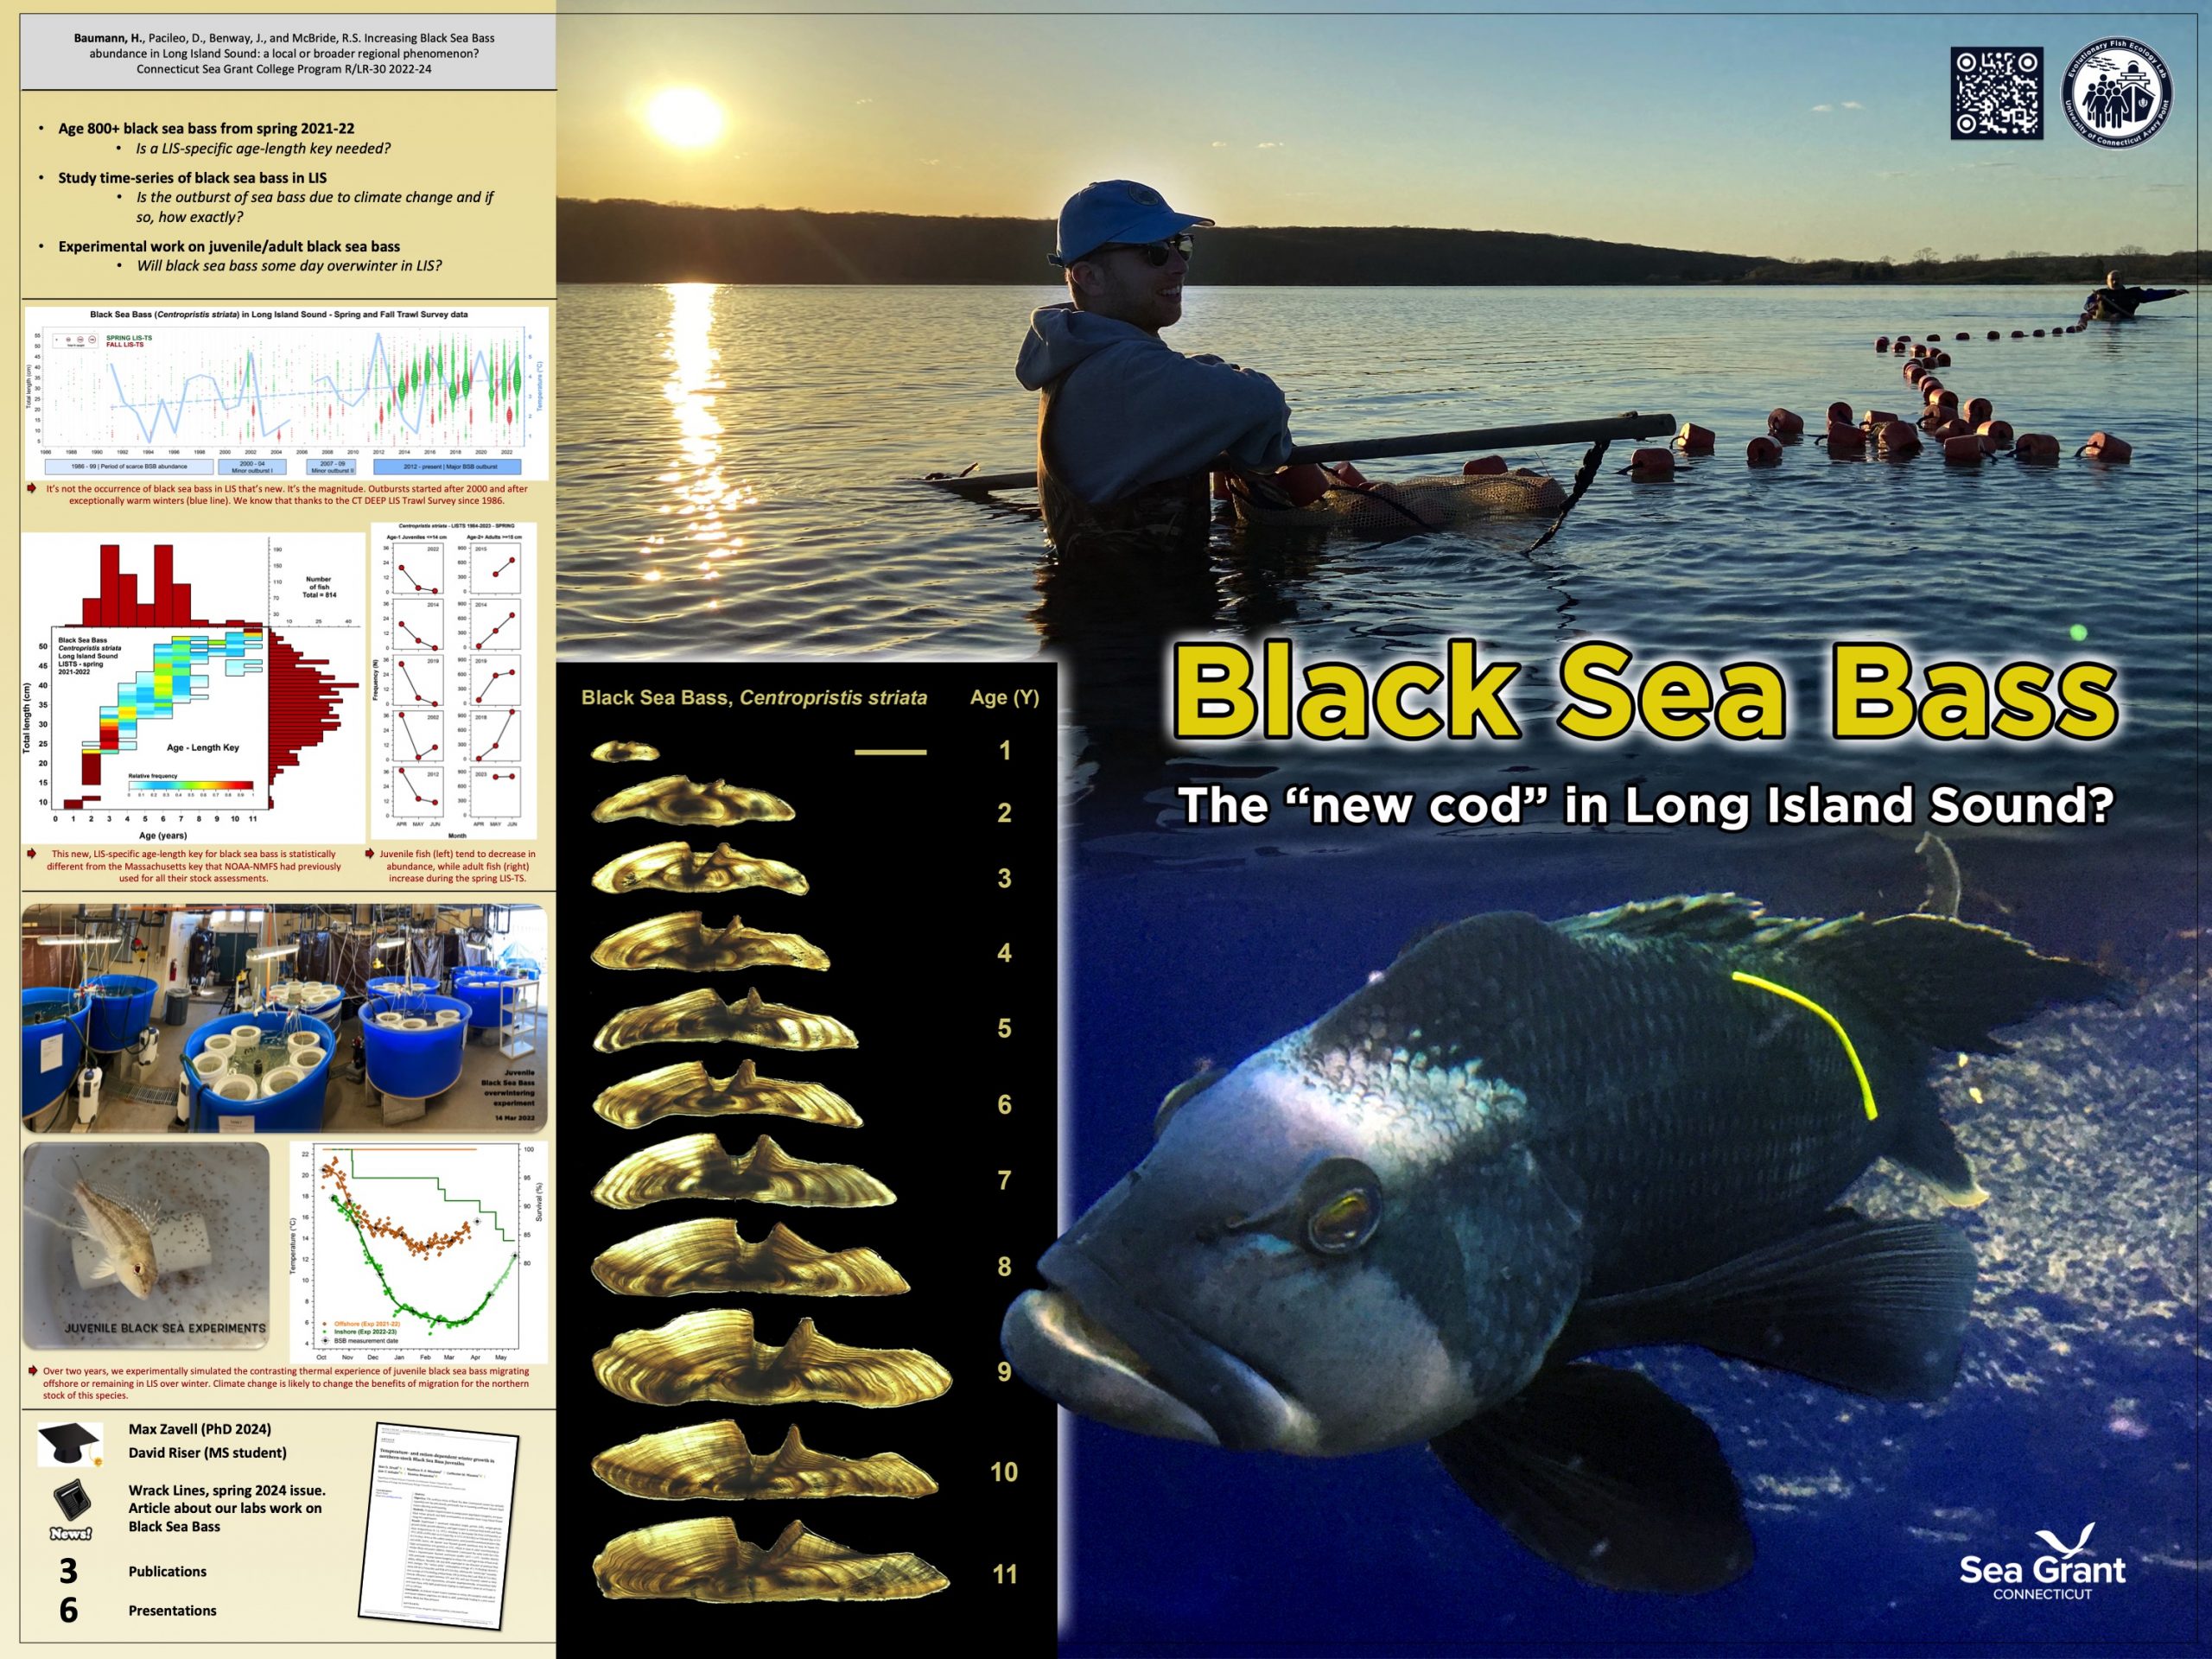
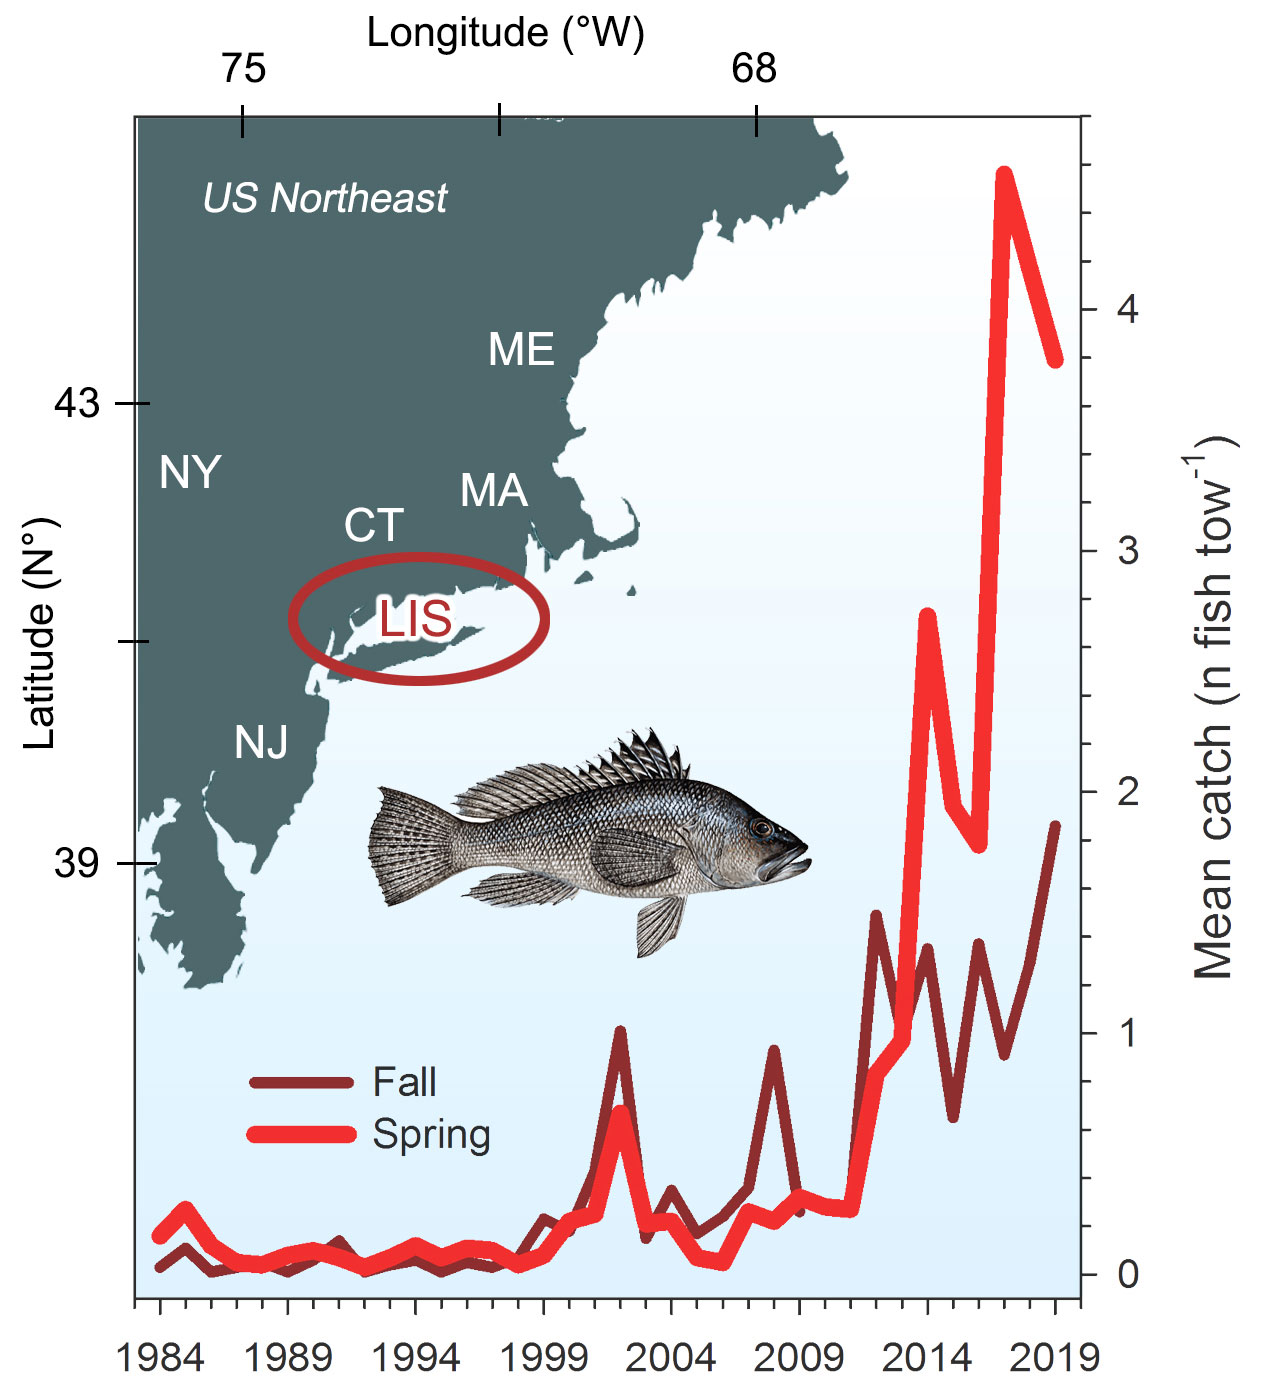
34. Increase in Black Sea Bass
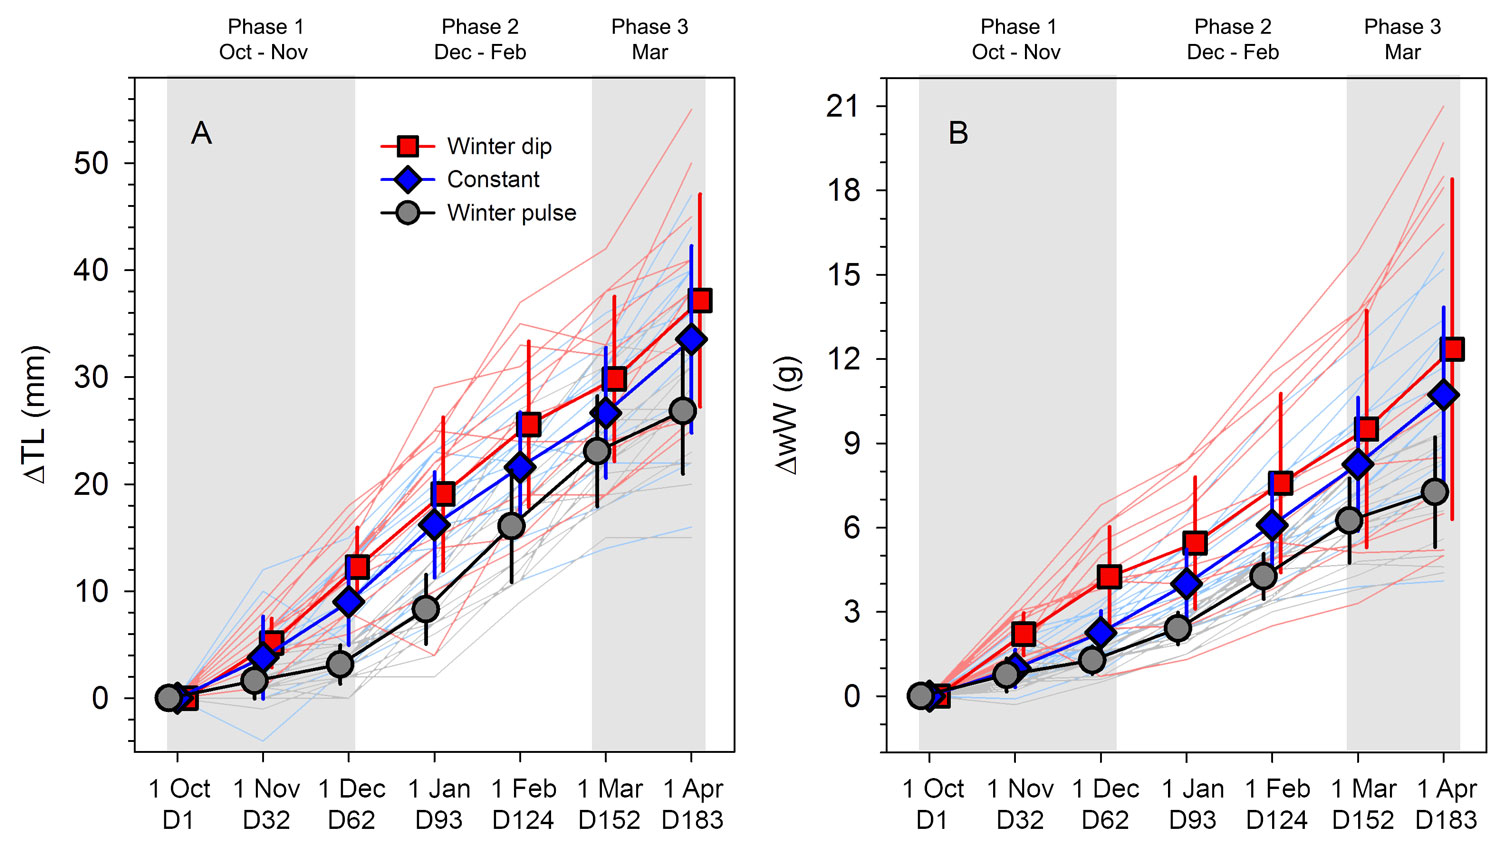
33. Winter growth of Black Sea Bass juveniles
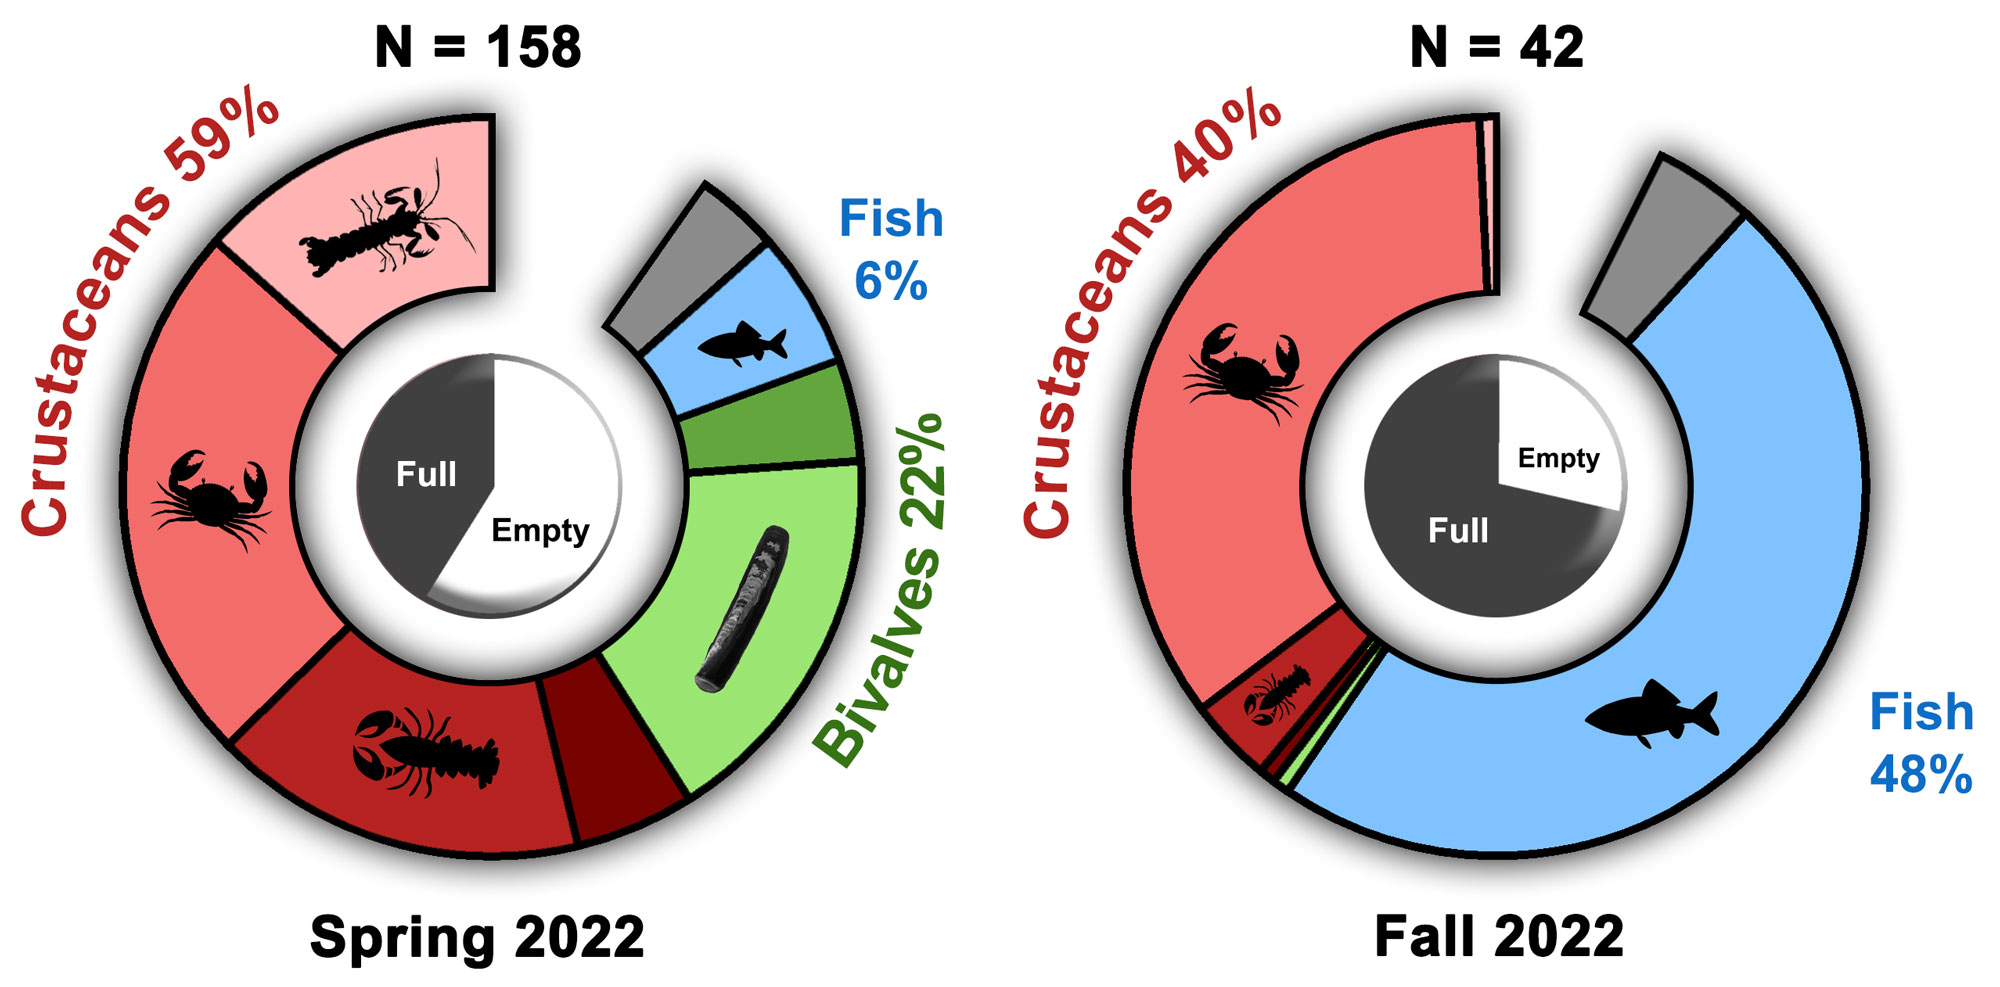
32. Black Sea Bass stomach content analysis
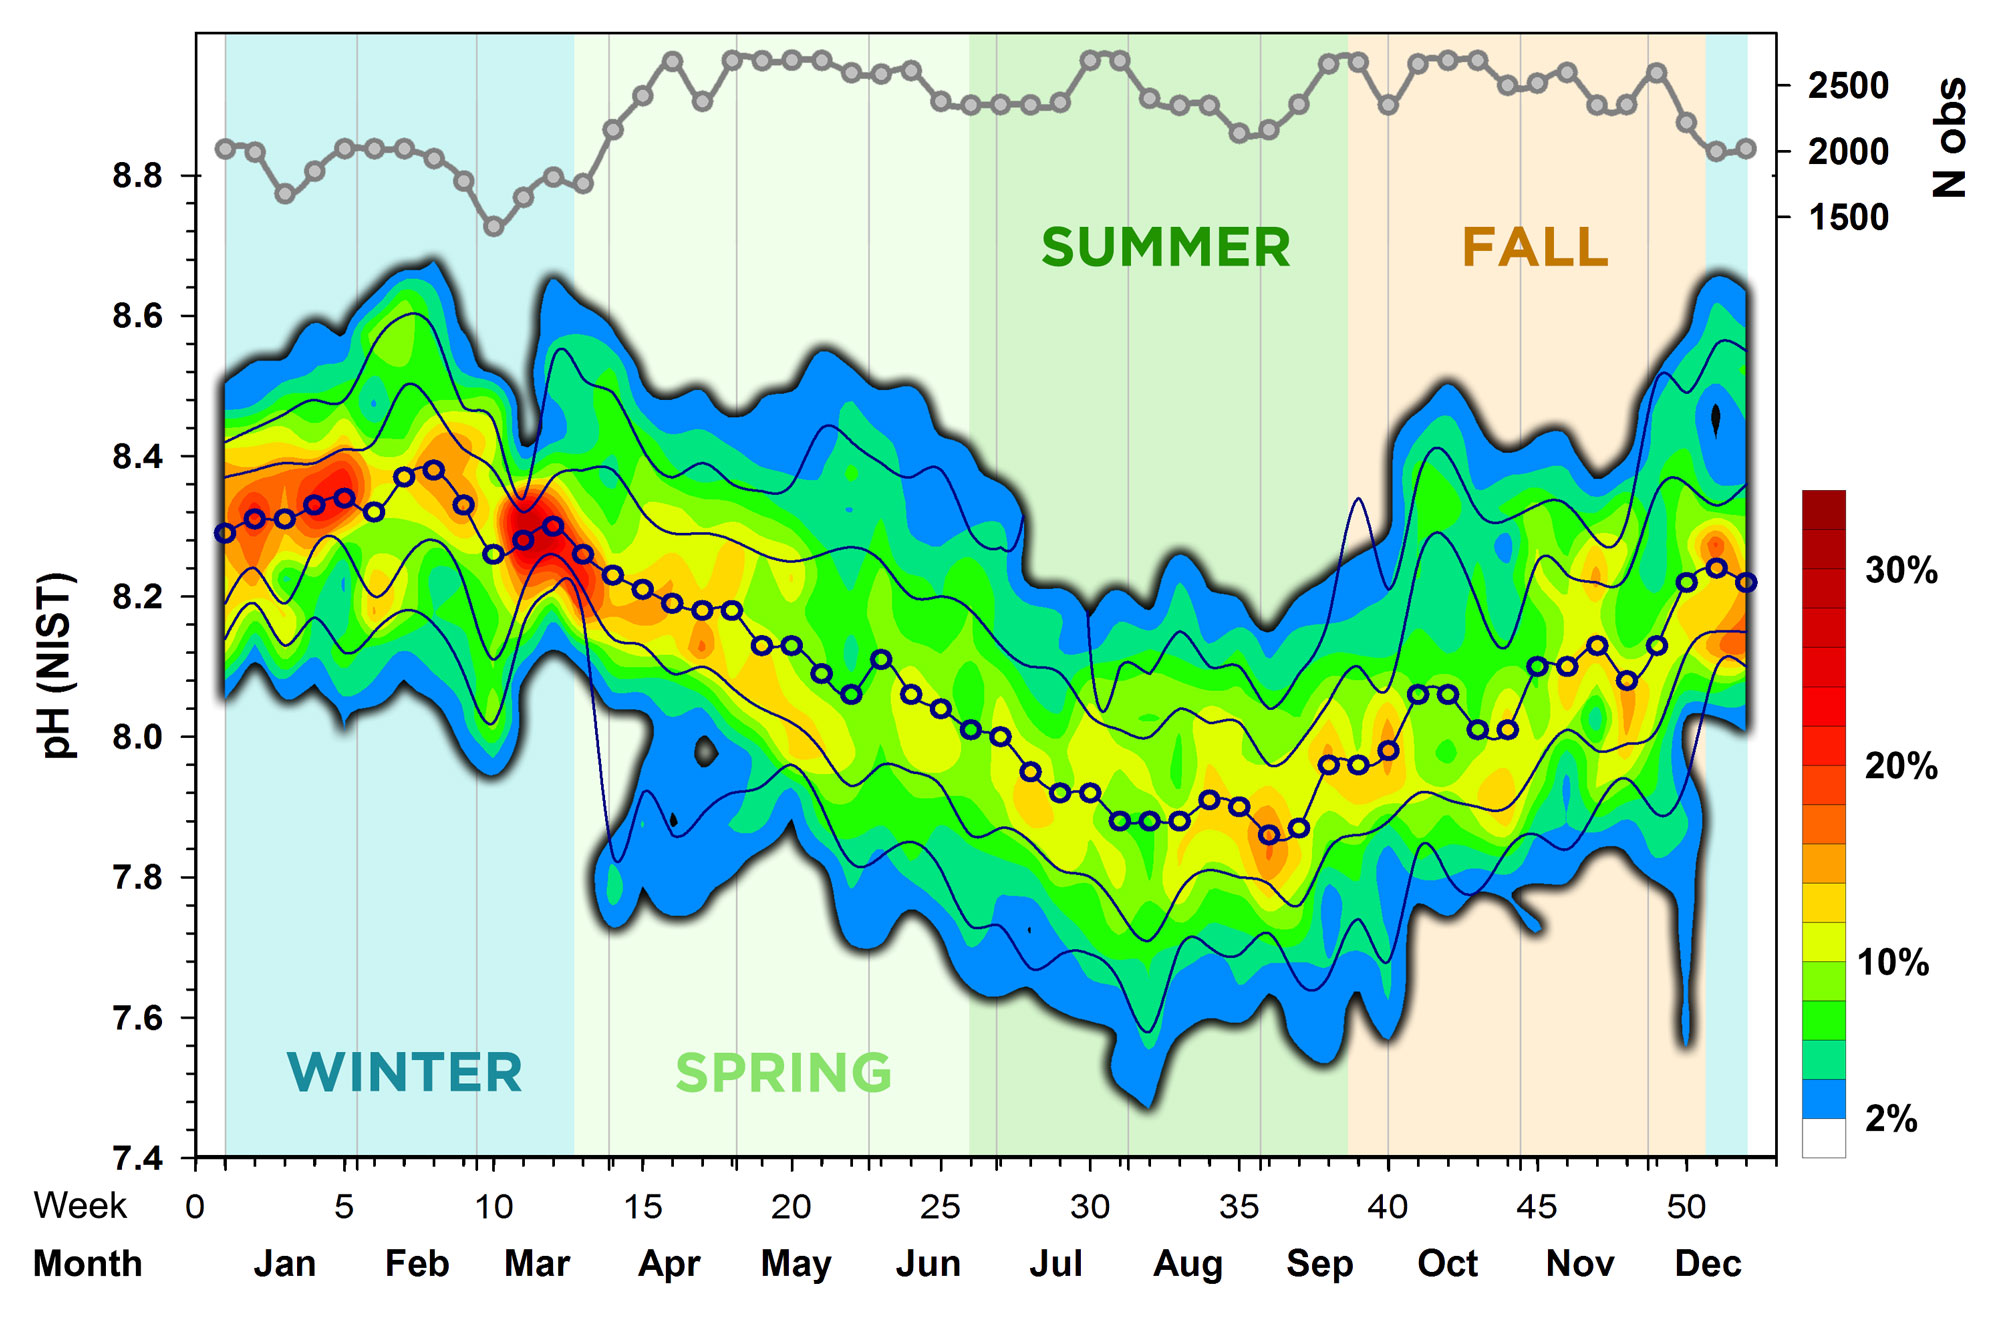
31. Dissolved oxygen conditions in Mumford Cove
30. Mumford Cove Environmental monitoring 2015-22
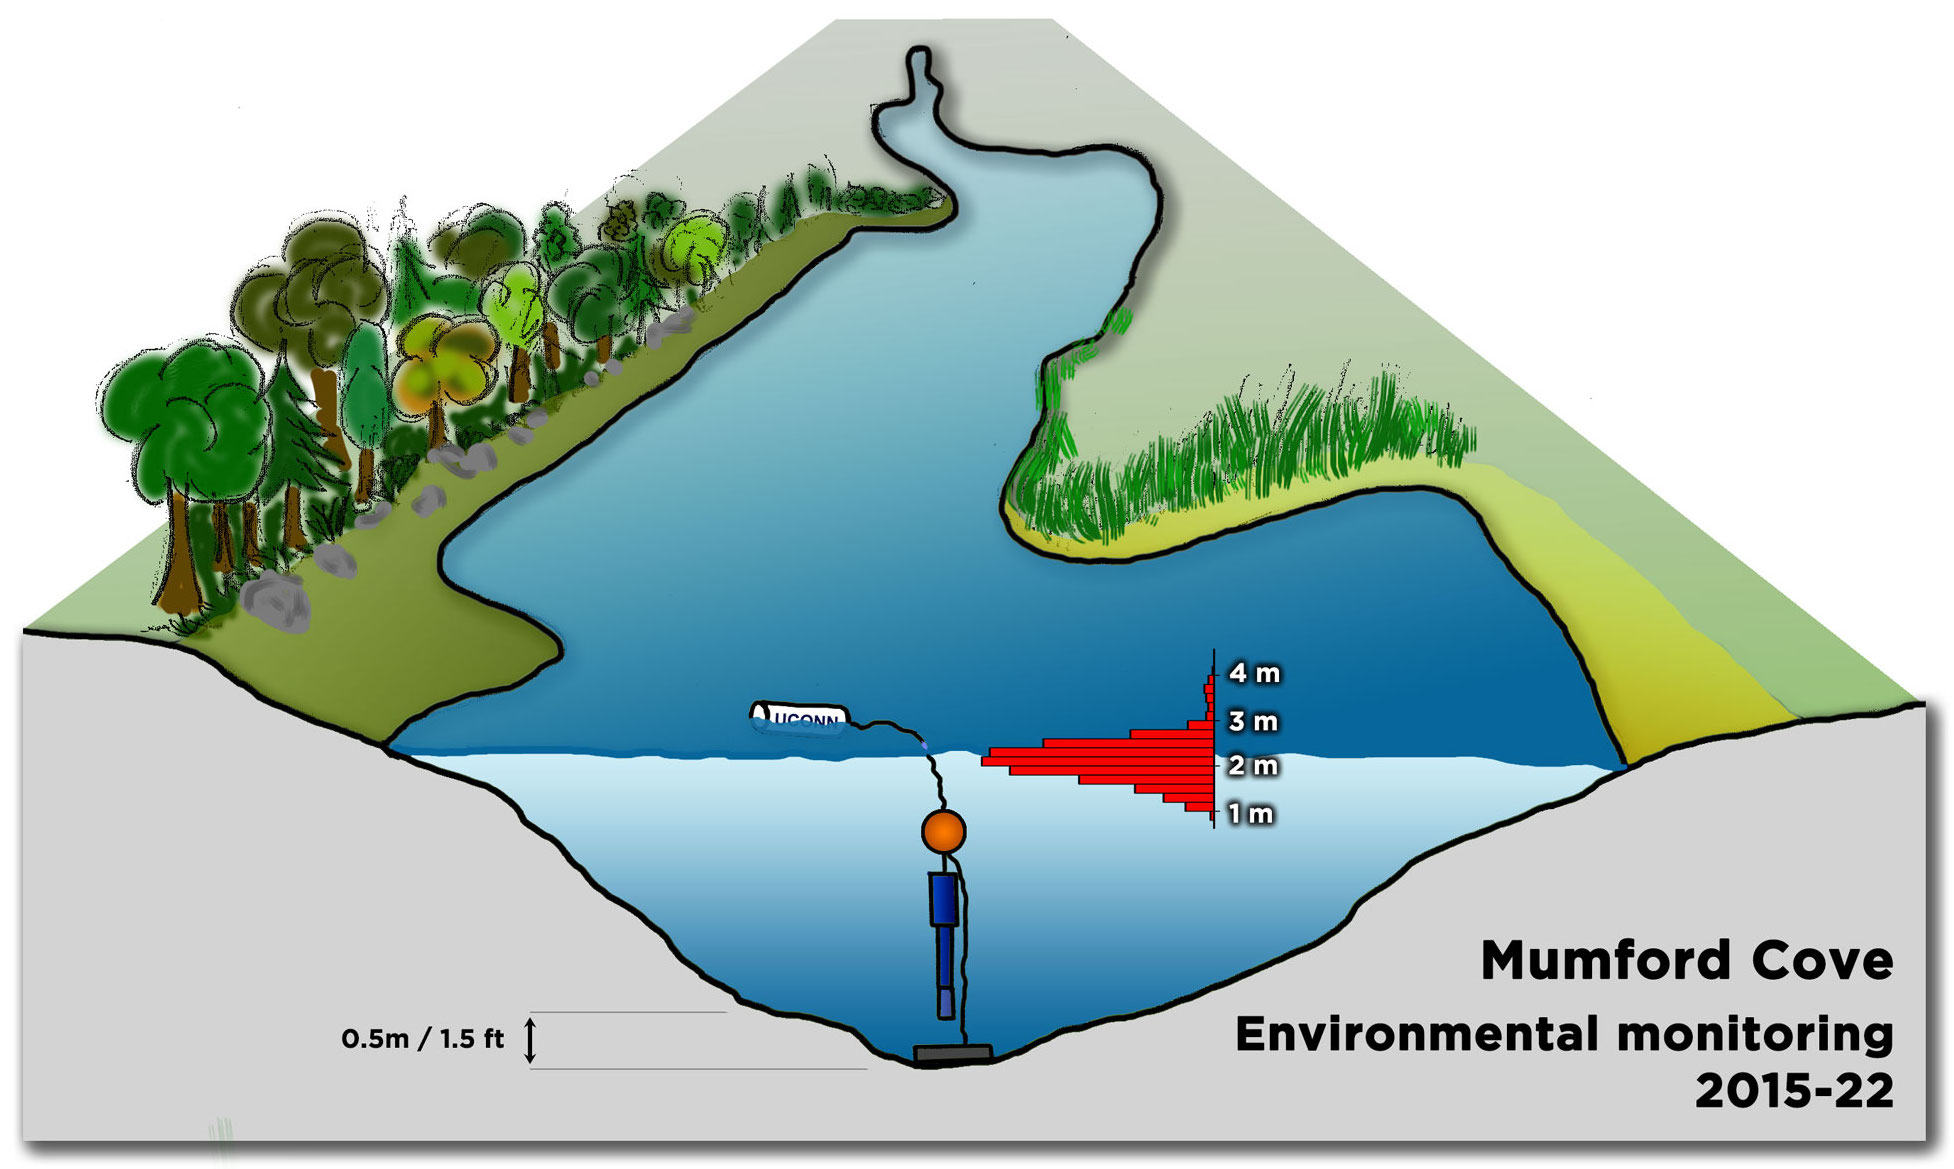
29. Mumford Cove Environmental monitoring 2015-22
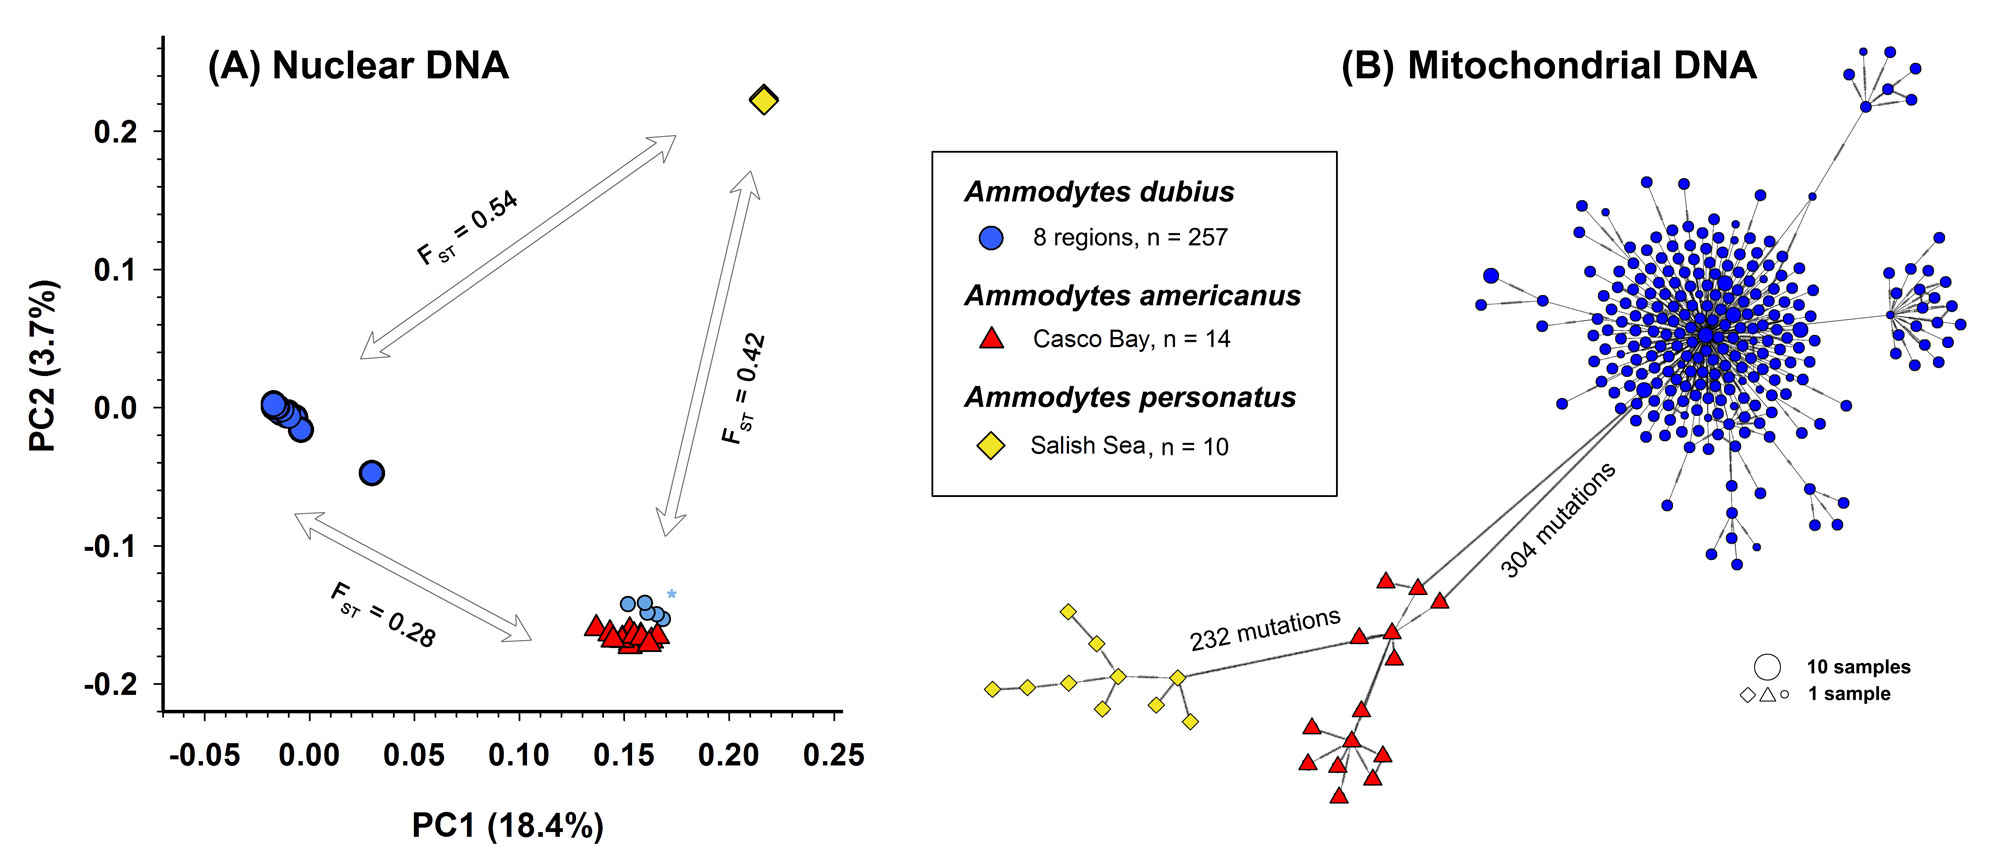
28. Genetic separation of A. dubius
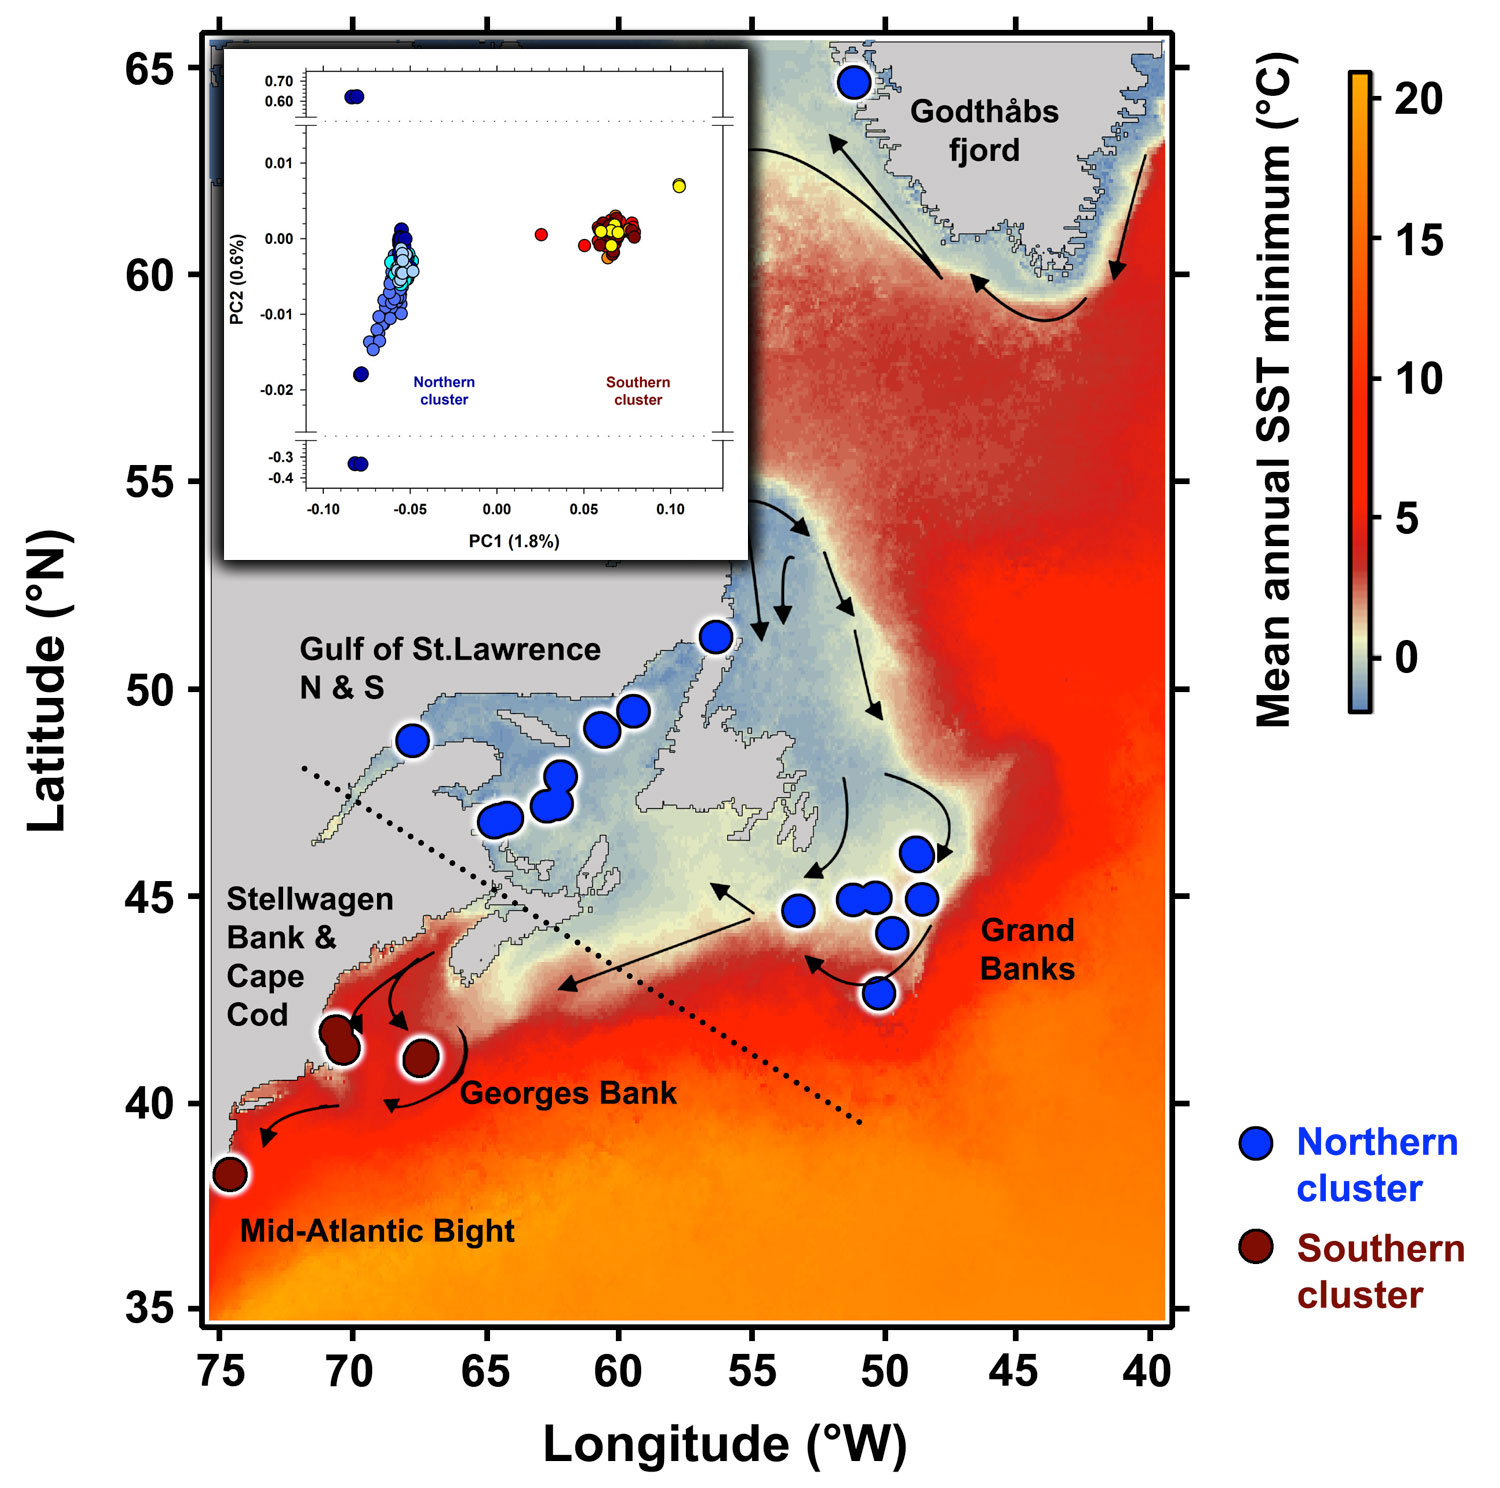
27. Separation of 3 sand lance species based nuclear and mitochondrial DNA (Jones et al. ICES JMS 2022)
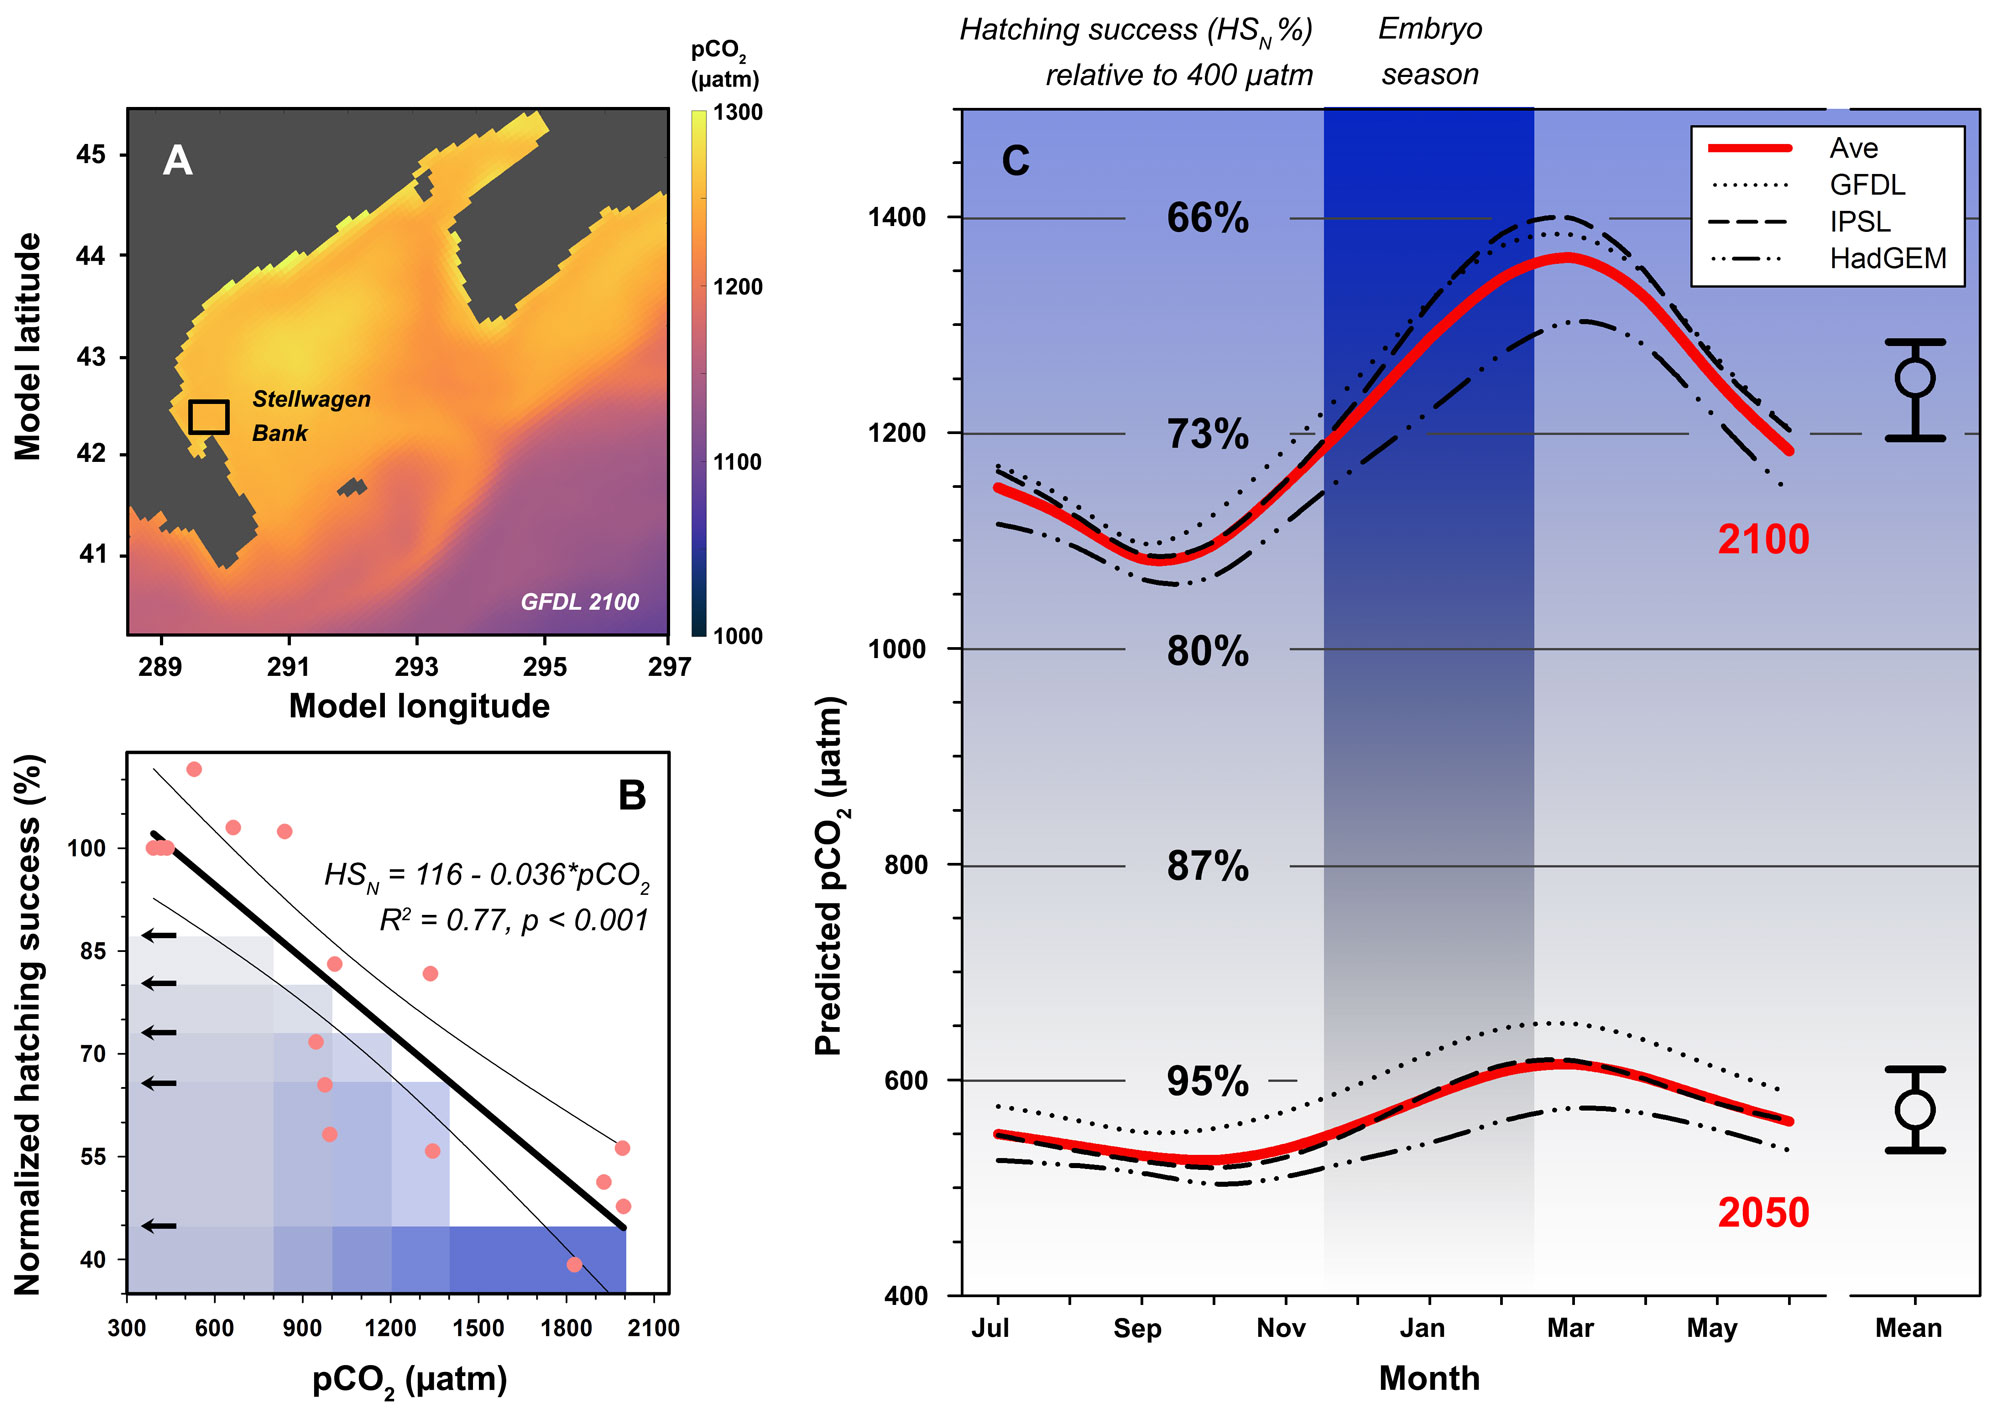
26. CO2-dependent hatching success of sand lance in the context of regional pCO2 projections. (Baumann et al. MEPS 2022)
25. Temperature-dependent effects of high CO2 on silverside fecundity after whole-life rearing (Concannon et al. ICES JMS 2021)

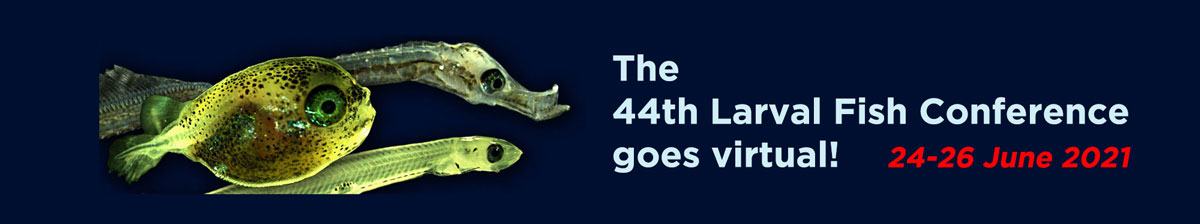
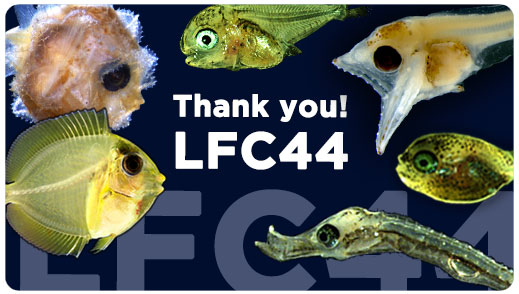
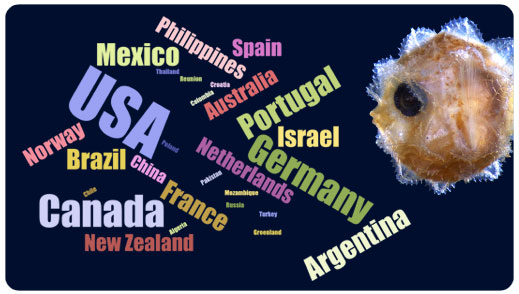
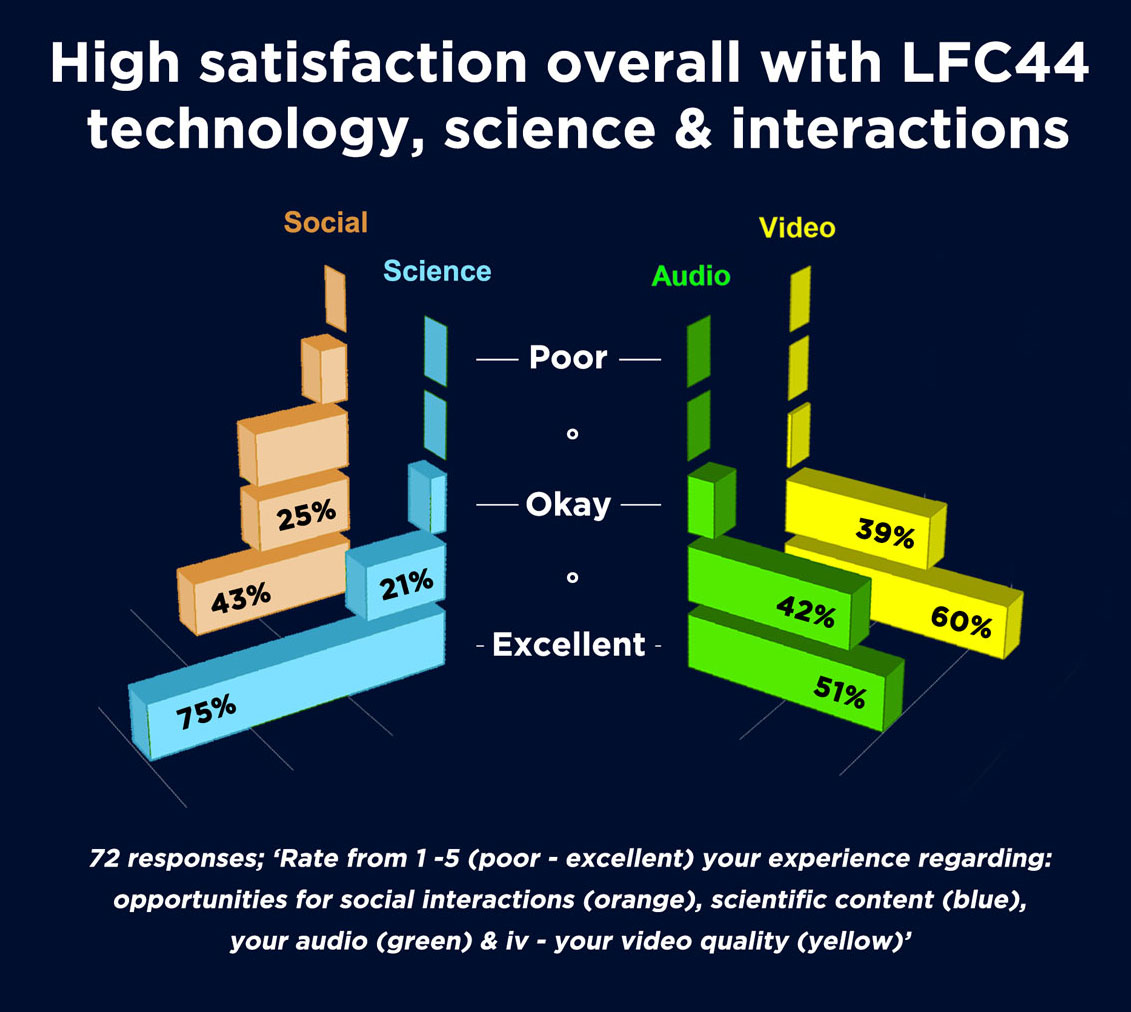
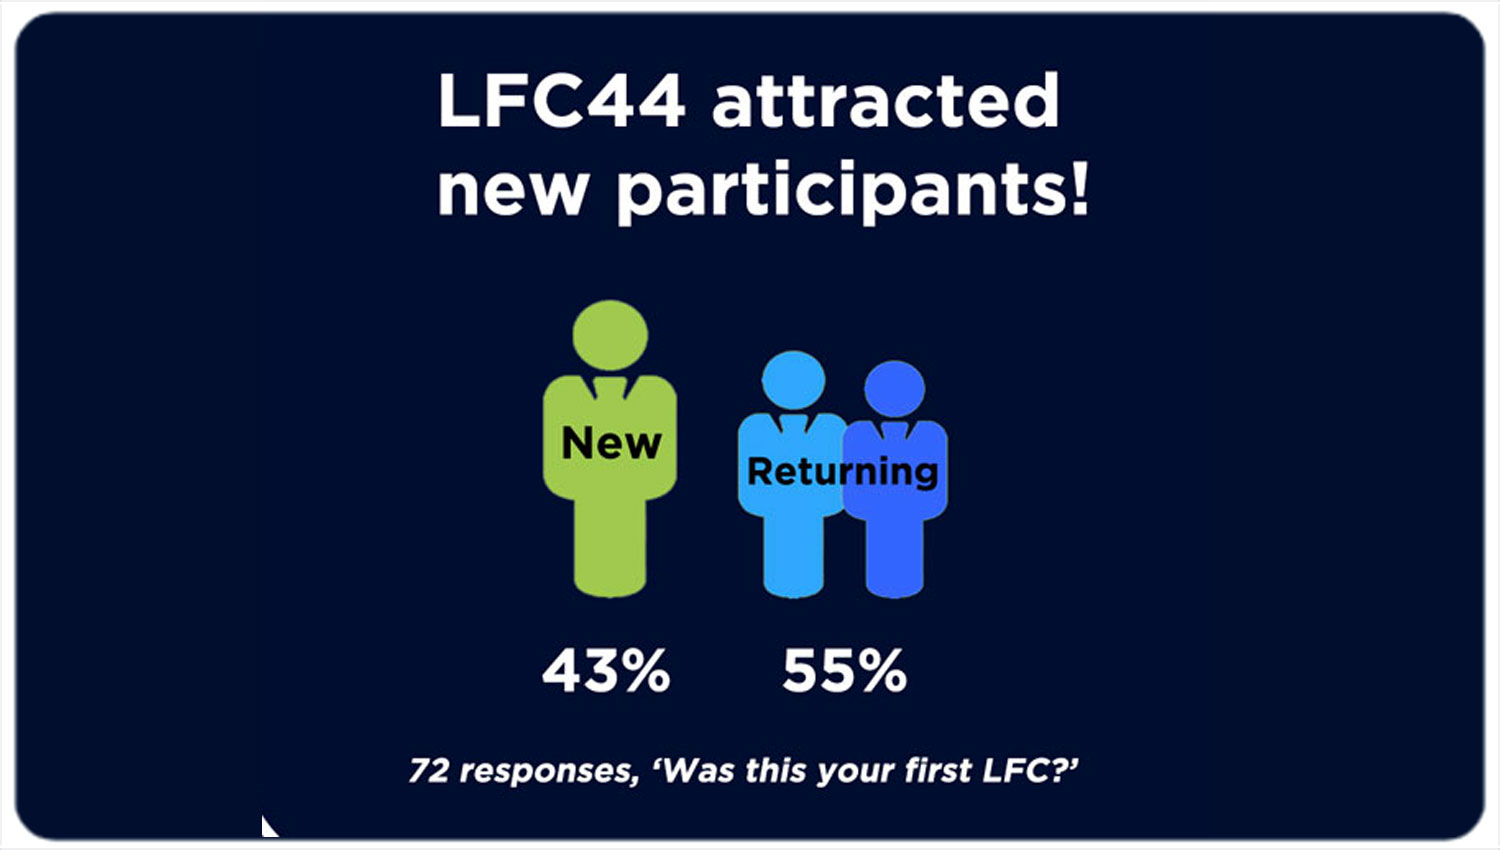
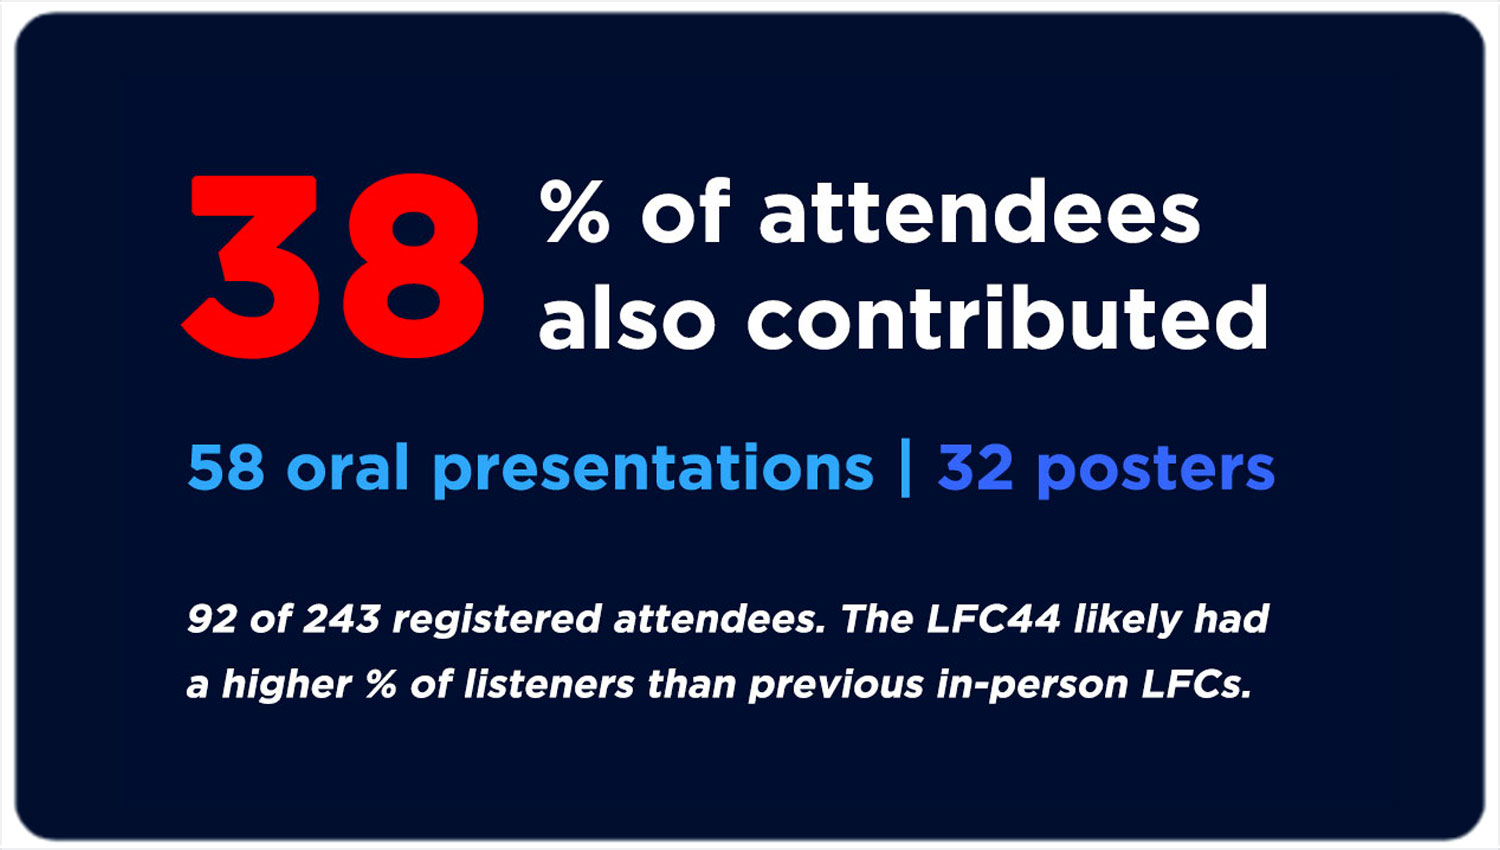
24. 44th Larval Fish Conference 2021 - Iconography
23. Logo of the Automated Larval Fish Rearing System (ALFiRiS)

22. Scientific illustrations for Chapter 11: Fish Ecology (Marine Biology, eds. Pan, J. & Pratolongo, P.D). in press
 Recruitment success in Baltic sprat Sprattus sprattus is related to the degree of retentive vs. dispersive hydrodynamic circulation patterns.


21. Otolith-based sex-specific reconstruction of silverside hatch dates
Pringle, J. & Baumann, H. (2019) Otolith-based growth reconstructions in young-of-year Atlantic silversides (Menidia menidia) and their implications for sex-selective survival. MEPS 632: 193-204
20. Design sketch for Atlantic sturgeon outreach signage (CTSG grant)
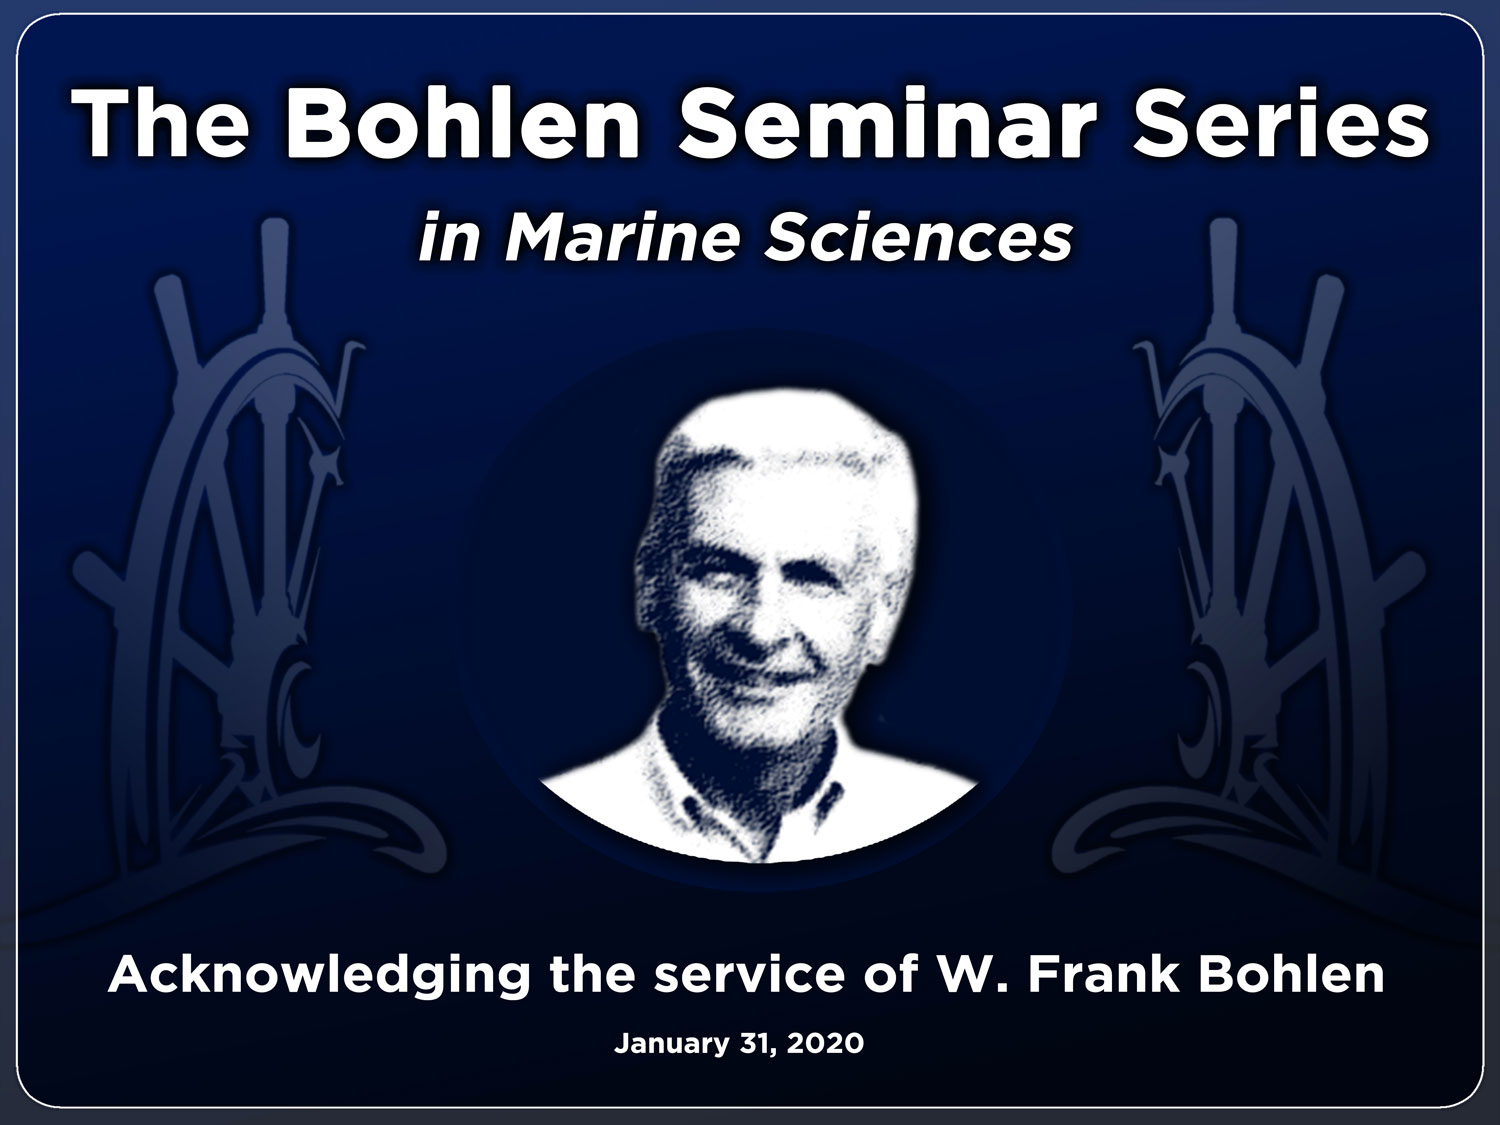
19. Commemoration plaque for Frank Bohlen Seminar
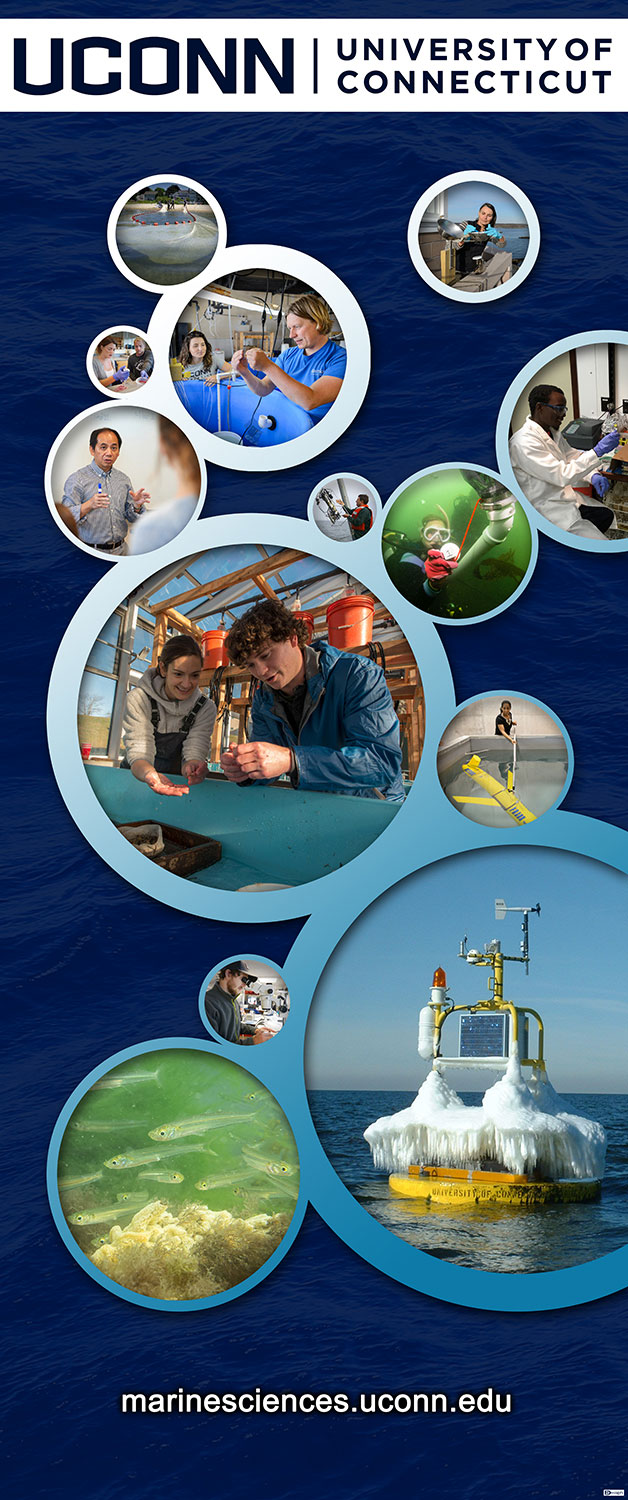
18. Conference Banner designs for the Department of Marine Sciences

17. Robust quantification of fish early life CO2 sensitivities via serial experimentation

Baumann, H., Cross, E.L., and Murray, C.S. Robust quantification of fish early life CO2 sensitivities via serial experimentation. Biology Letters 14:20180408
16. Always look on the silverside of life - Lab T-Shirts
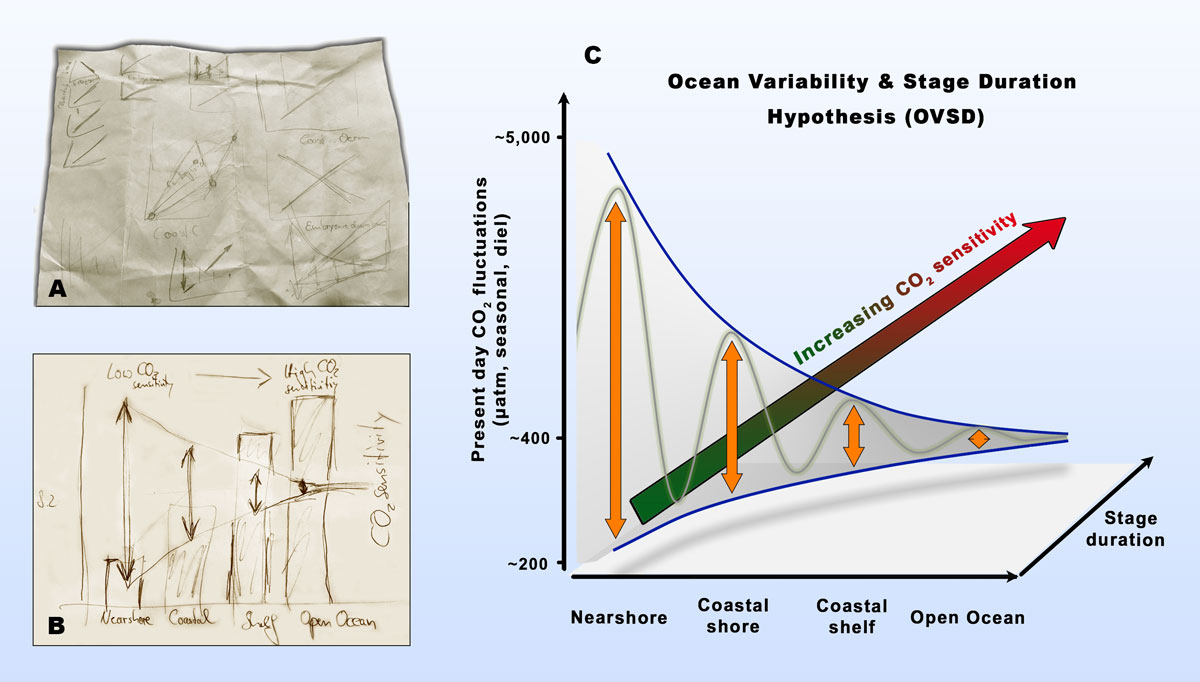
15. Ocean variability and Stage Duration hypothesis: a genesis
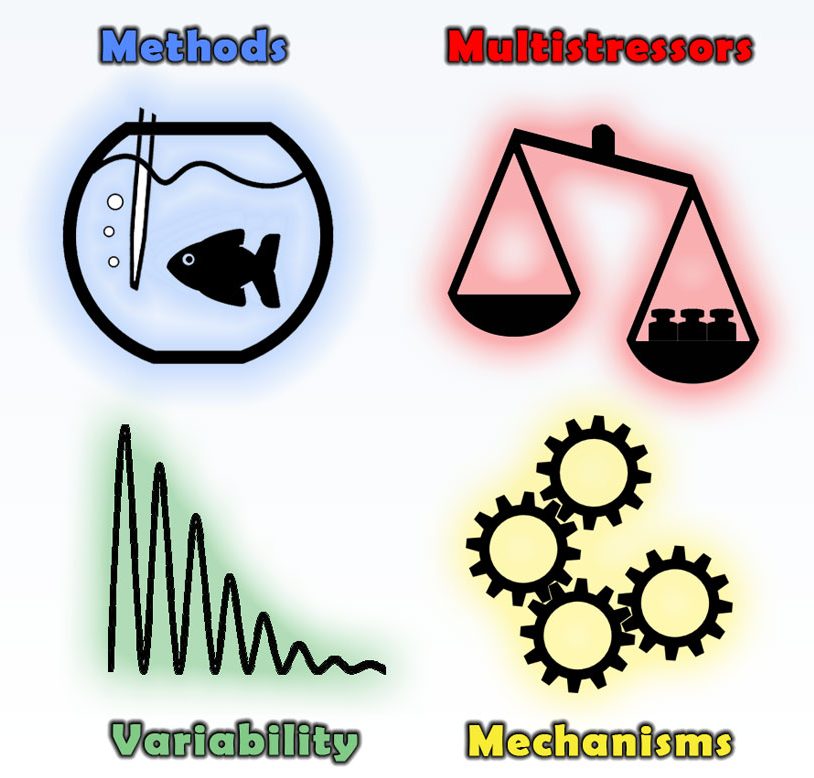
14. Four key areas of advances in experimental ocean acidification research
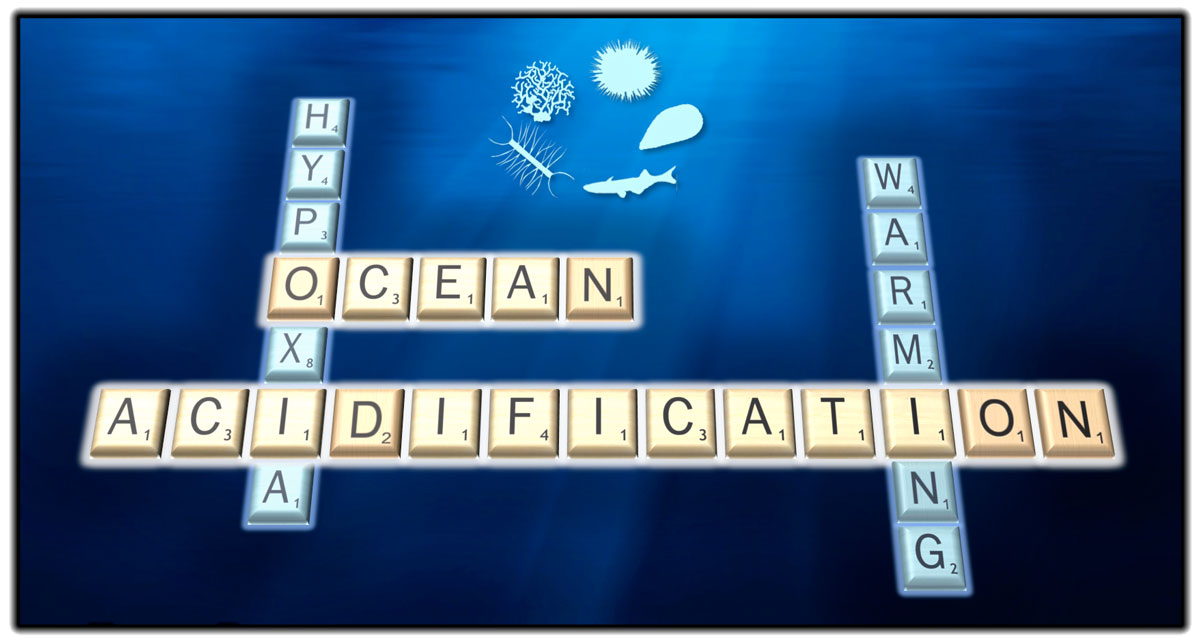
13. Iconography used in the OA PI summary talk
12. Friends of Marine Sciences - logo and outreach slide


11. Multistressor title art (L&O e-lectures)
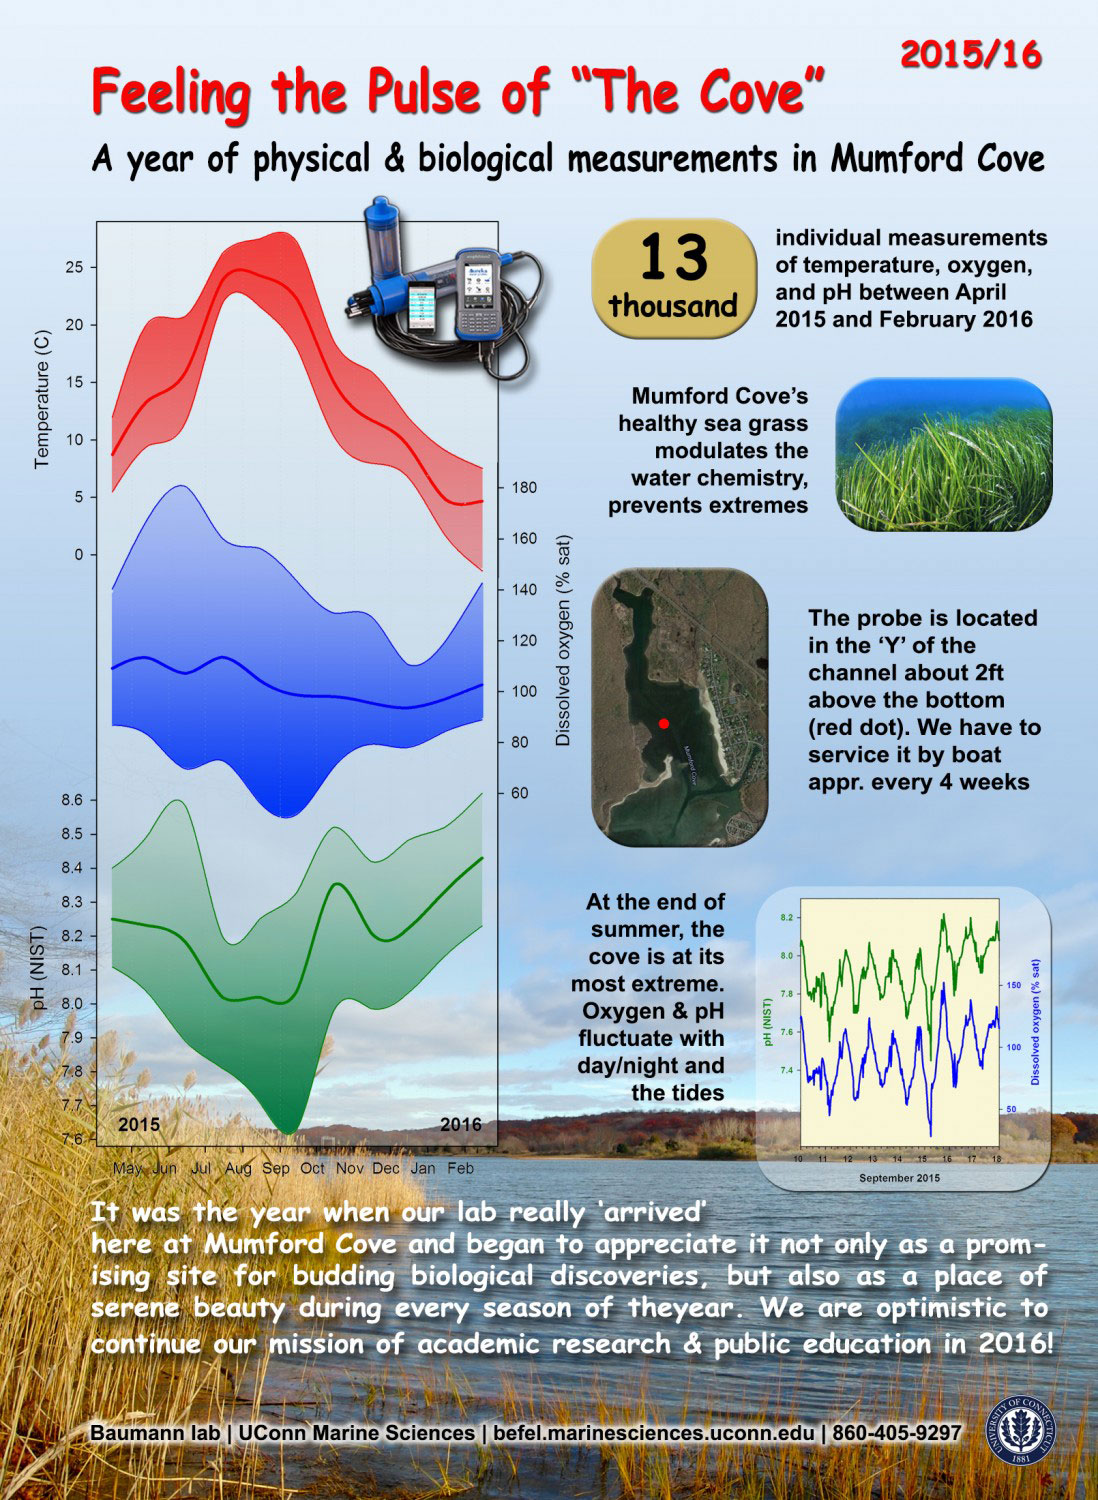
10. Seasonal covariation of pH and dissolved oxygen in a temperate tidal salt marsh (aka "The turkeys")
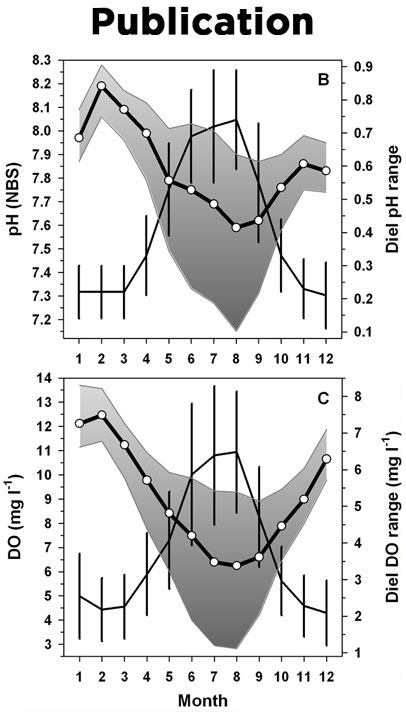
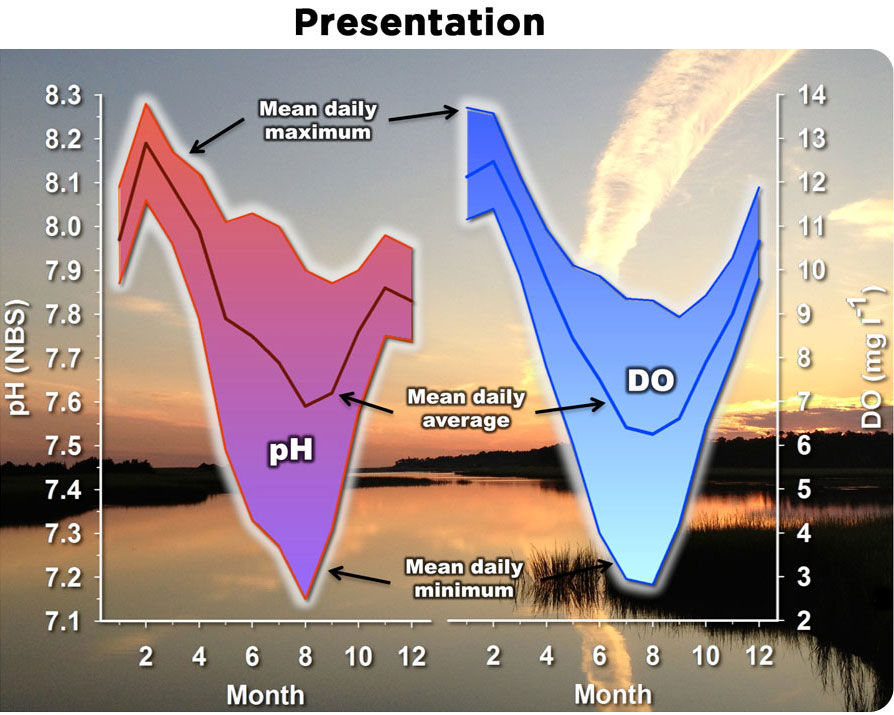
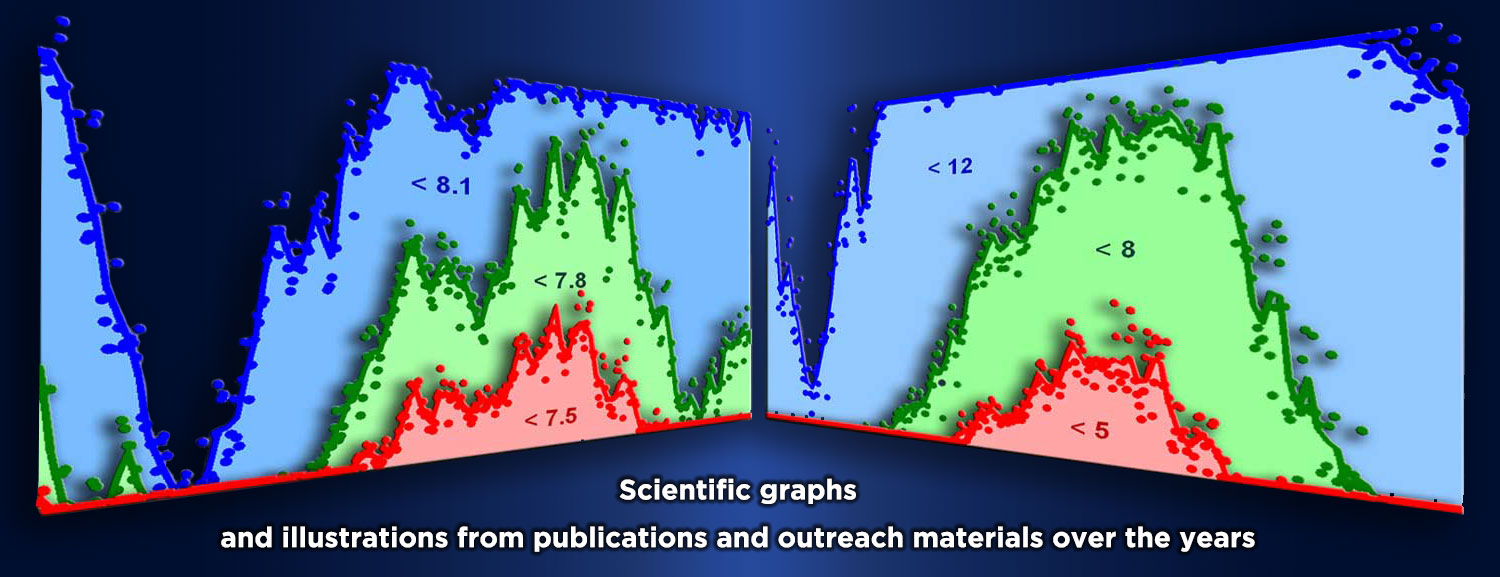
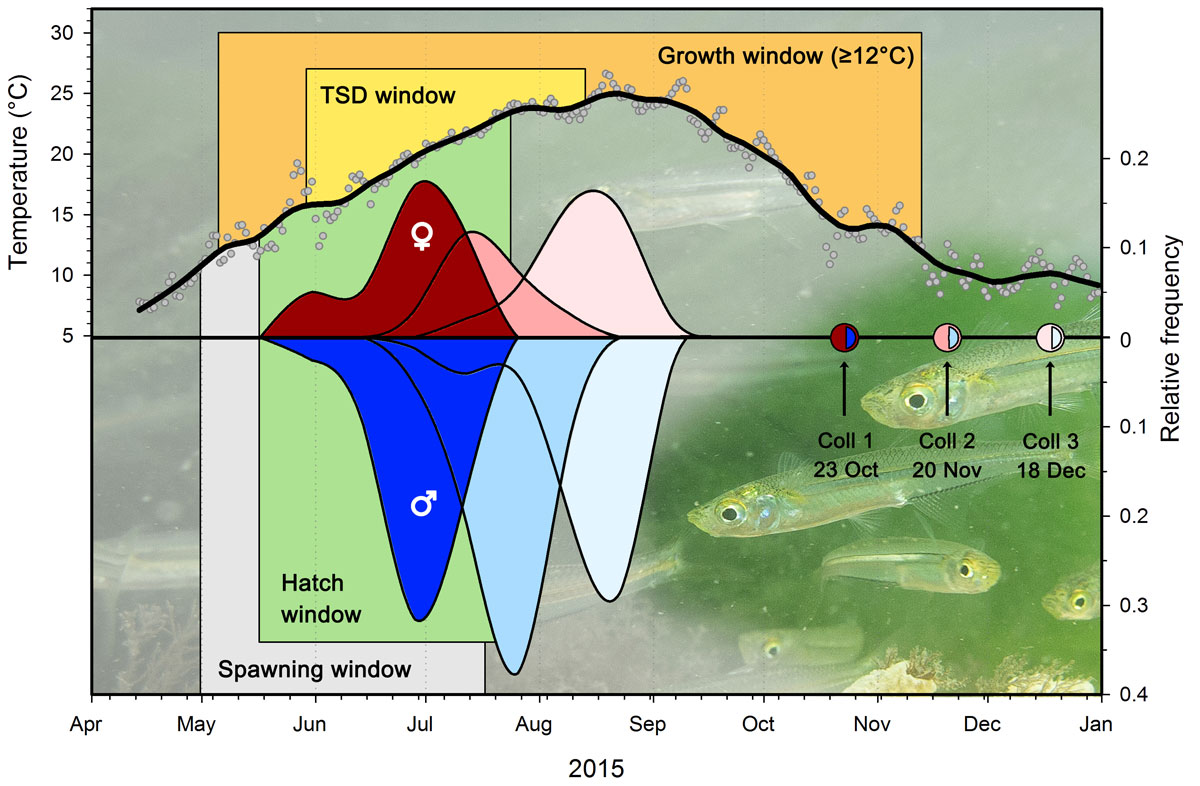
Scientific graphs often get used for different purposes. In a publication (left side), the focus is on clarity, simplicity, and the use of colors is often constrained. But when the same data are used in a presentation, for example at a conference, the graphs are best reworked and adapted so that they capture the audience attention. Here, the use of the background sets the stage for the particular habitat the study is talking about, whereas the graphs are combined, colored and annotated. In a presentation, nobody can read a figure caption!
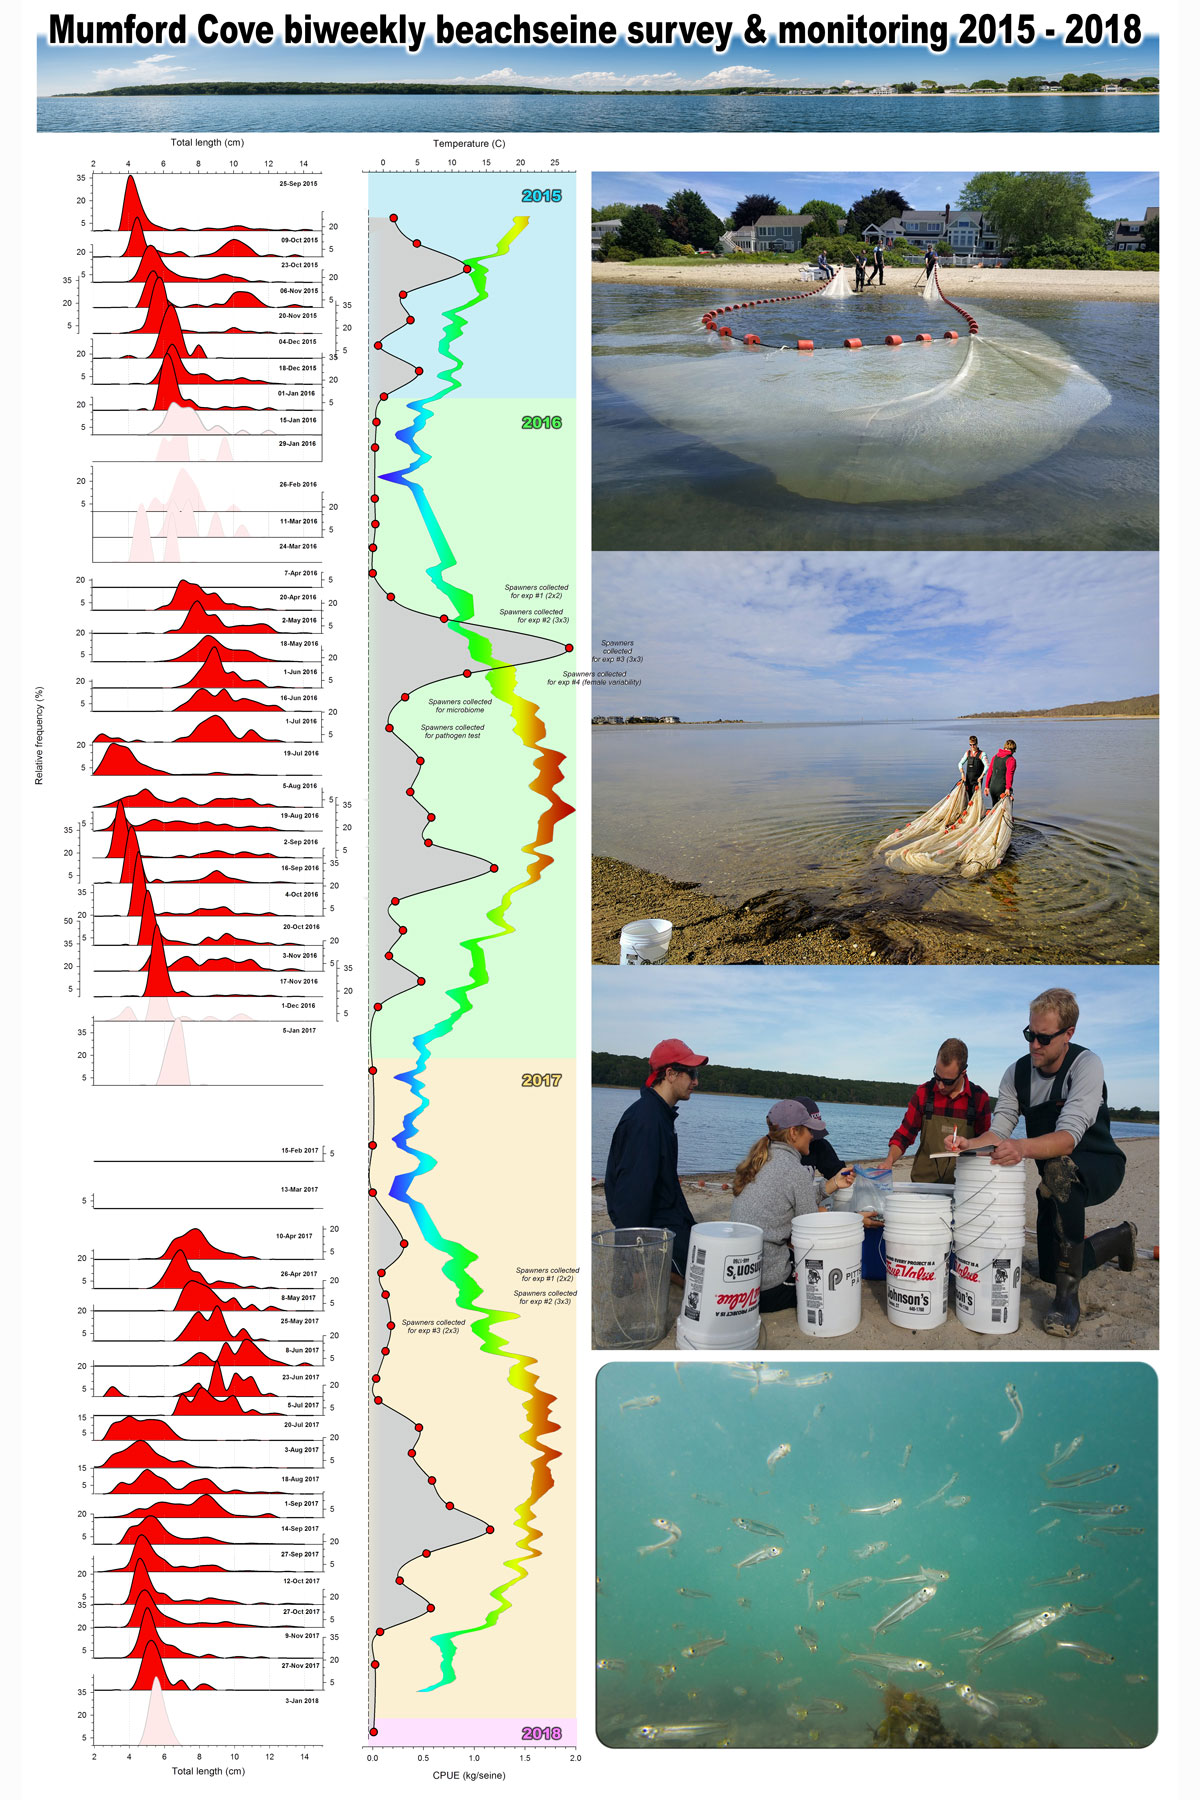
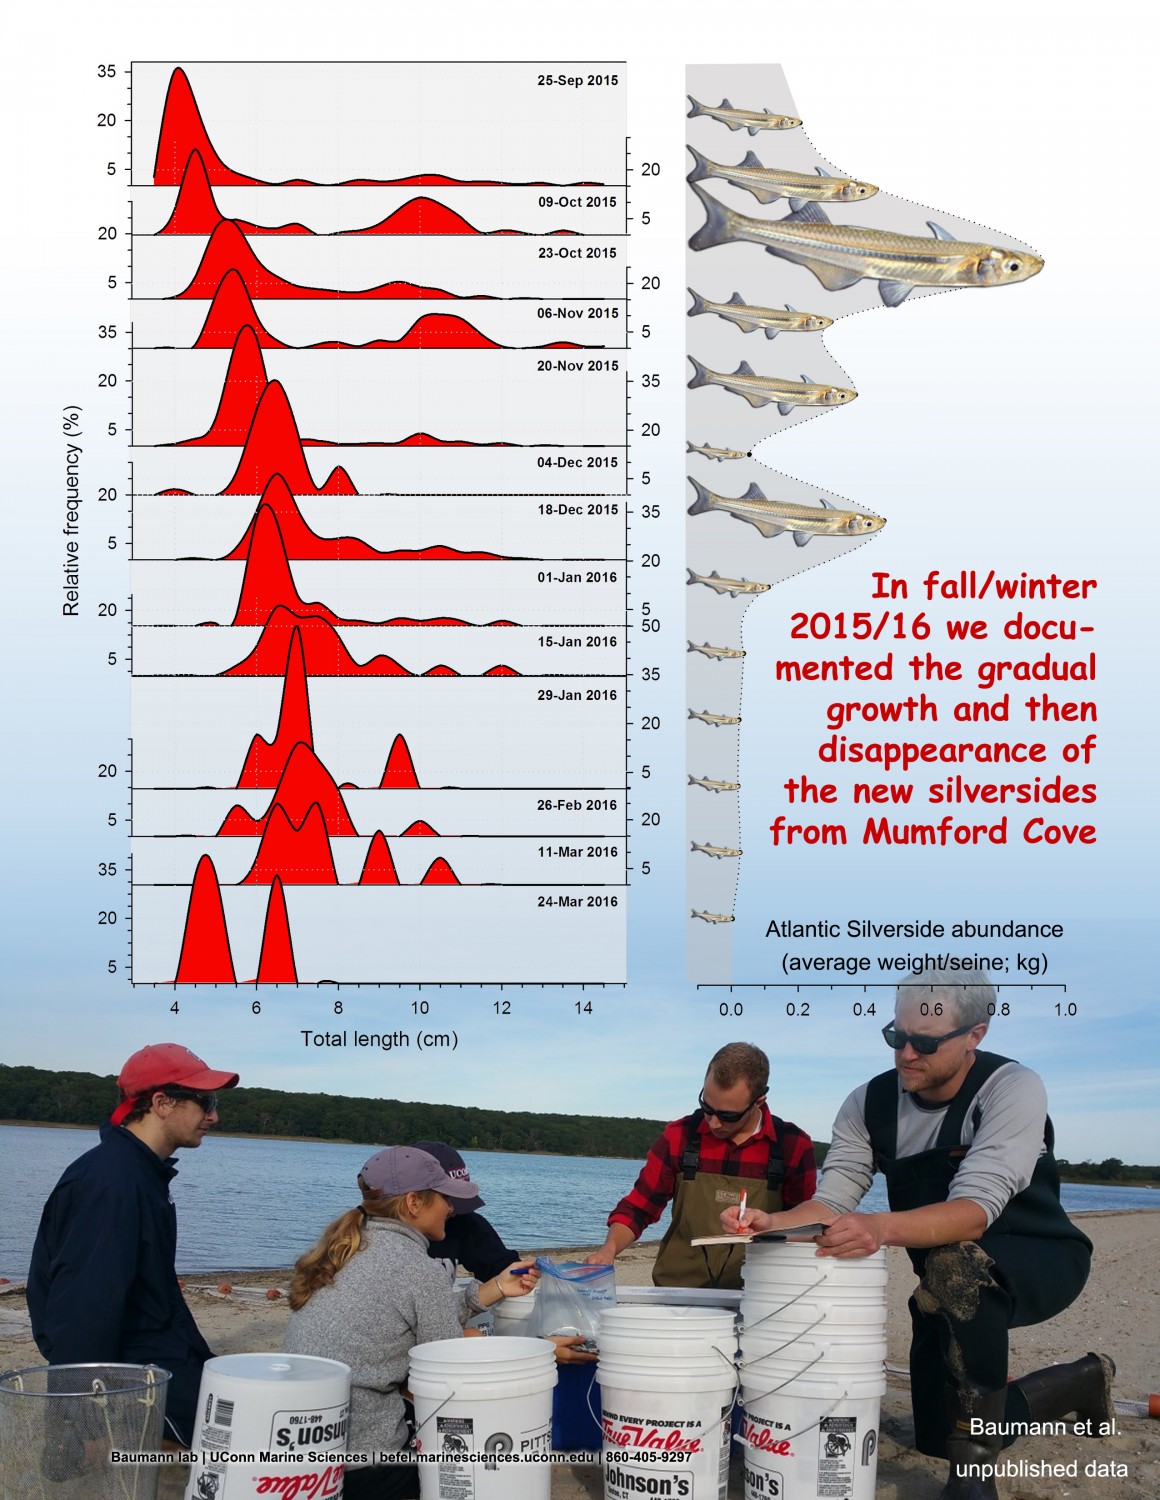
9. Mumford Cove biweekly beach seine survey and environmental monitoring (2015-2018)
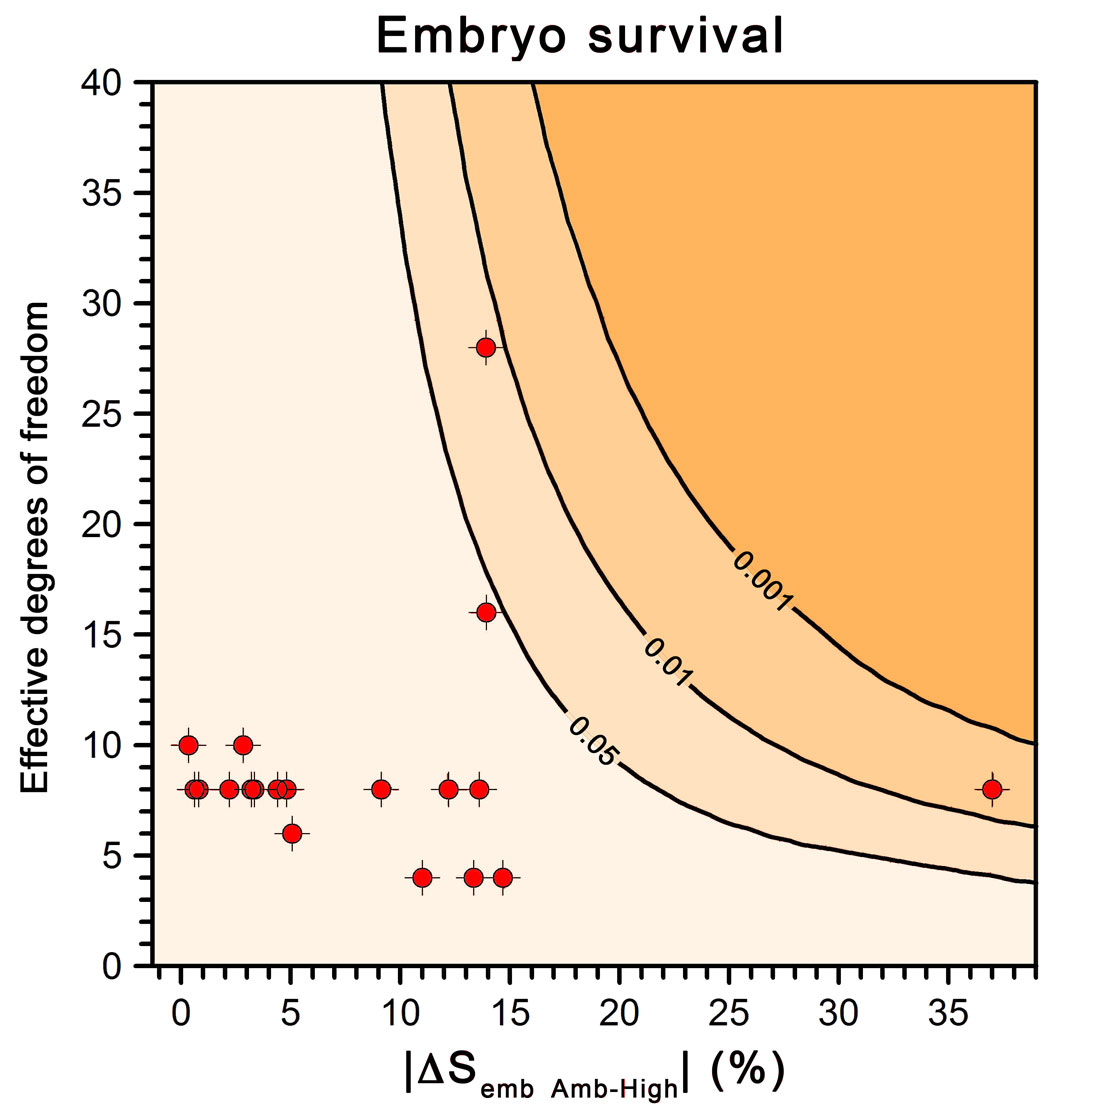
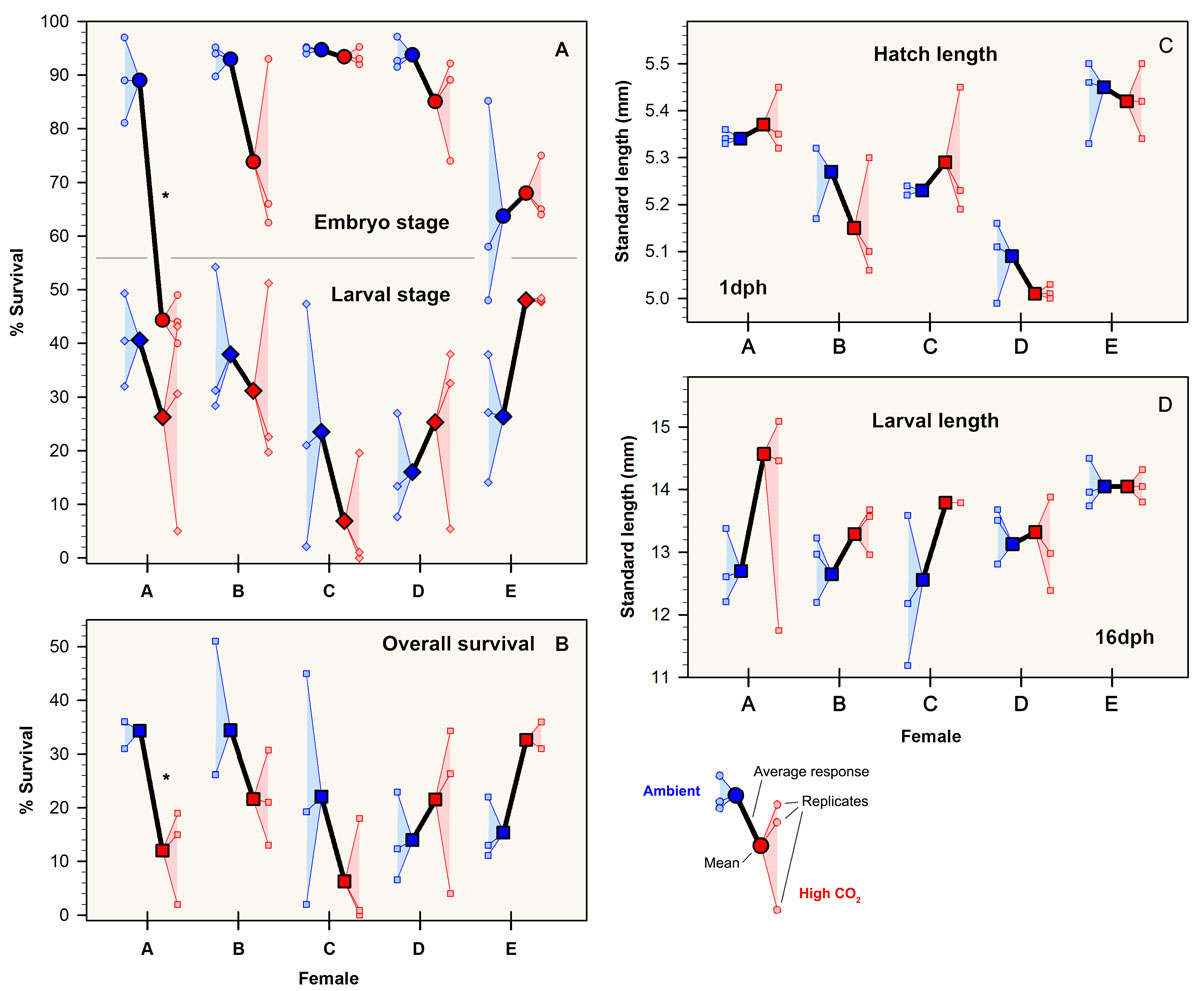
8. CO2 sensitivity of fish embryos and larvae from different mothers (aka "The dancing men")
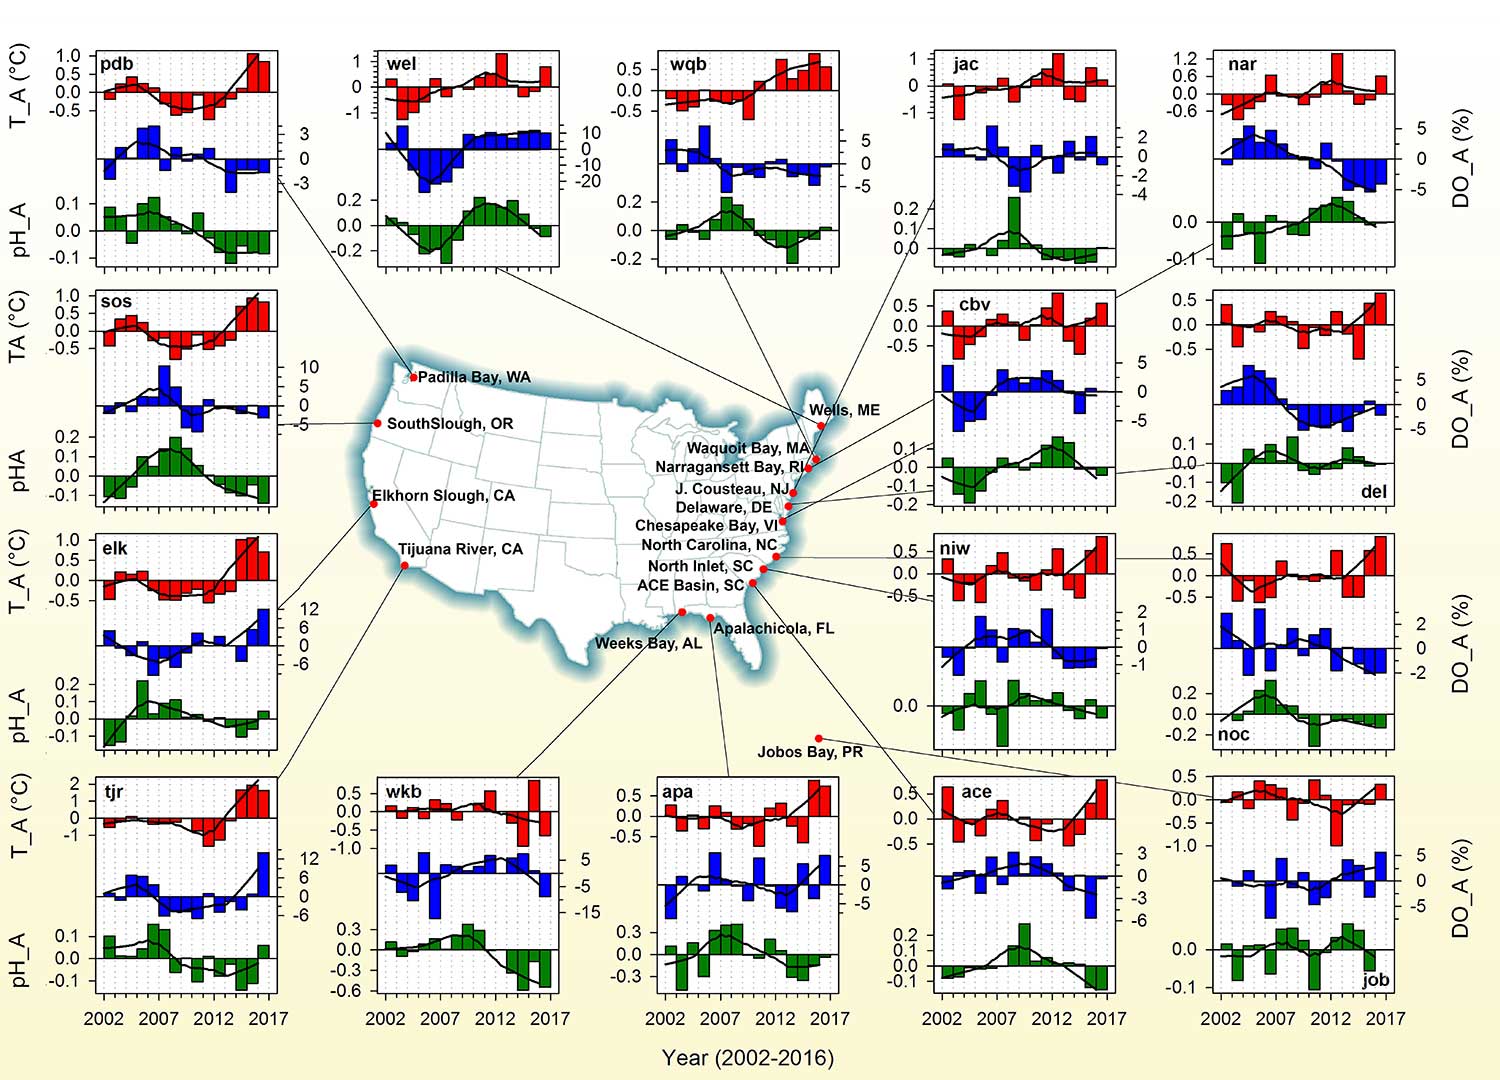
7. Depicting interannual trends in temperature, pH, and dissolved oxygen in 16 nearshore estuaries
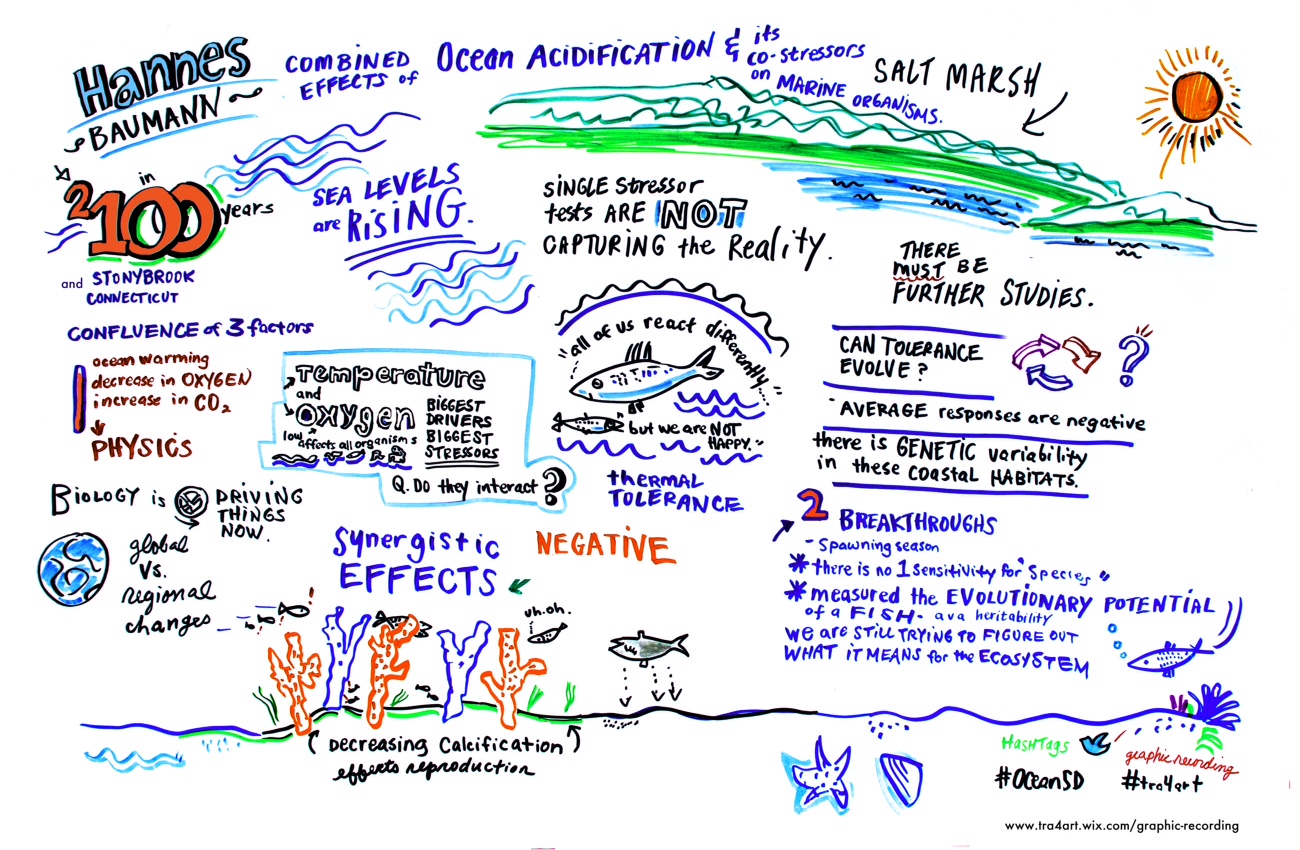
6. Graphical recording of Hannes' talk at Columbia University by Tracey Berglund
5. Outreach material for the Mumford Cove Association
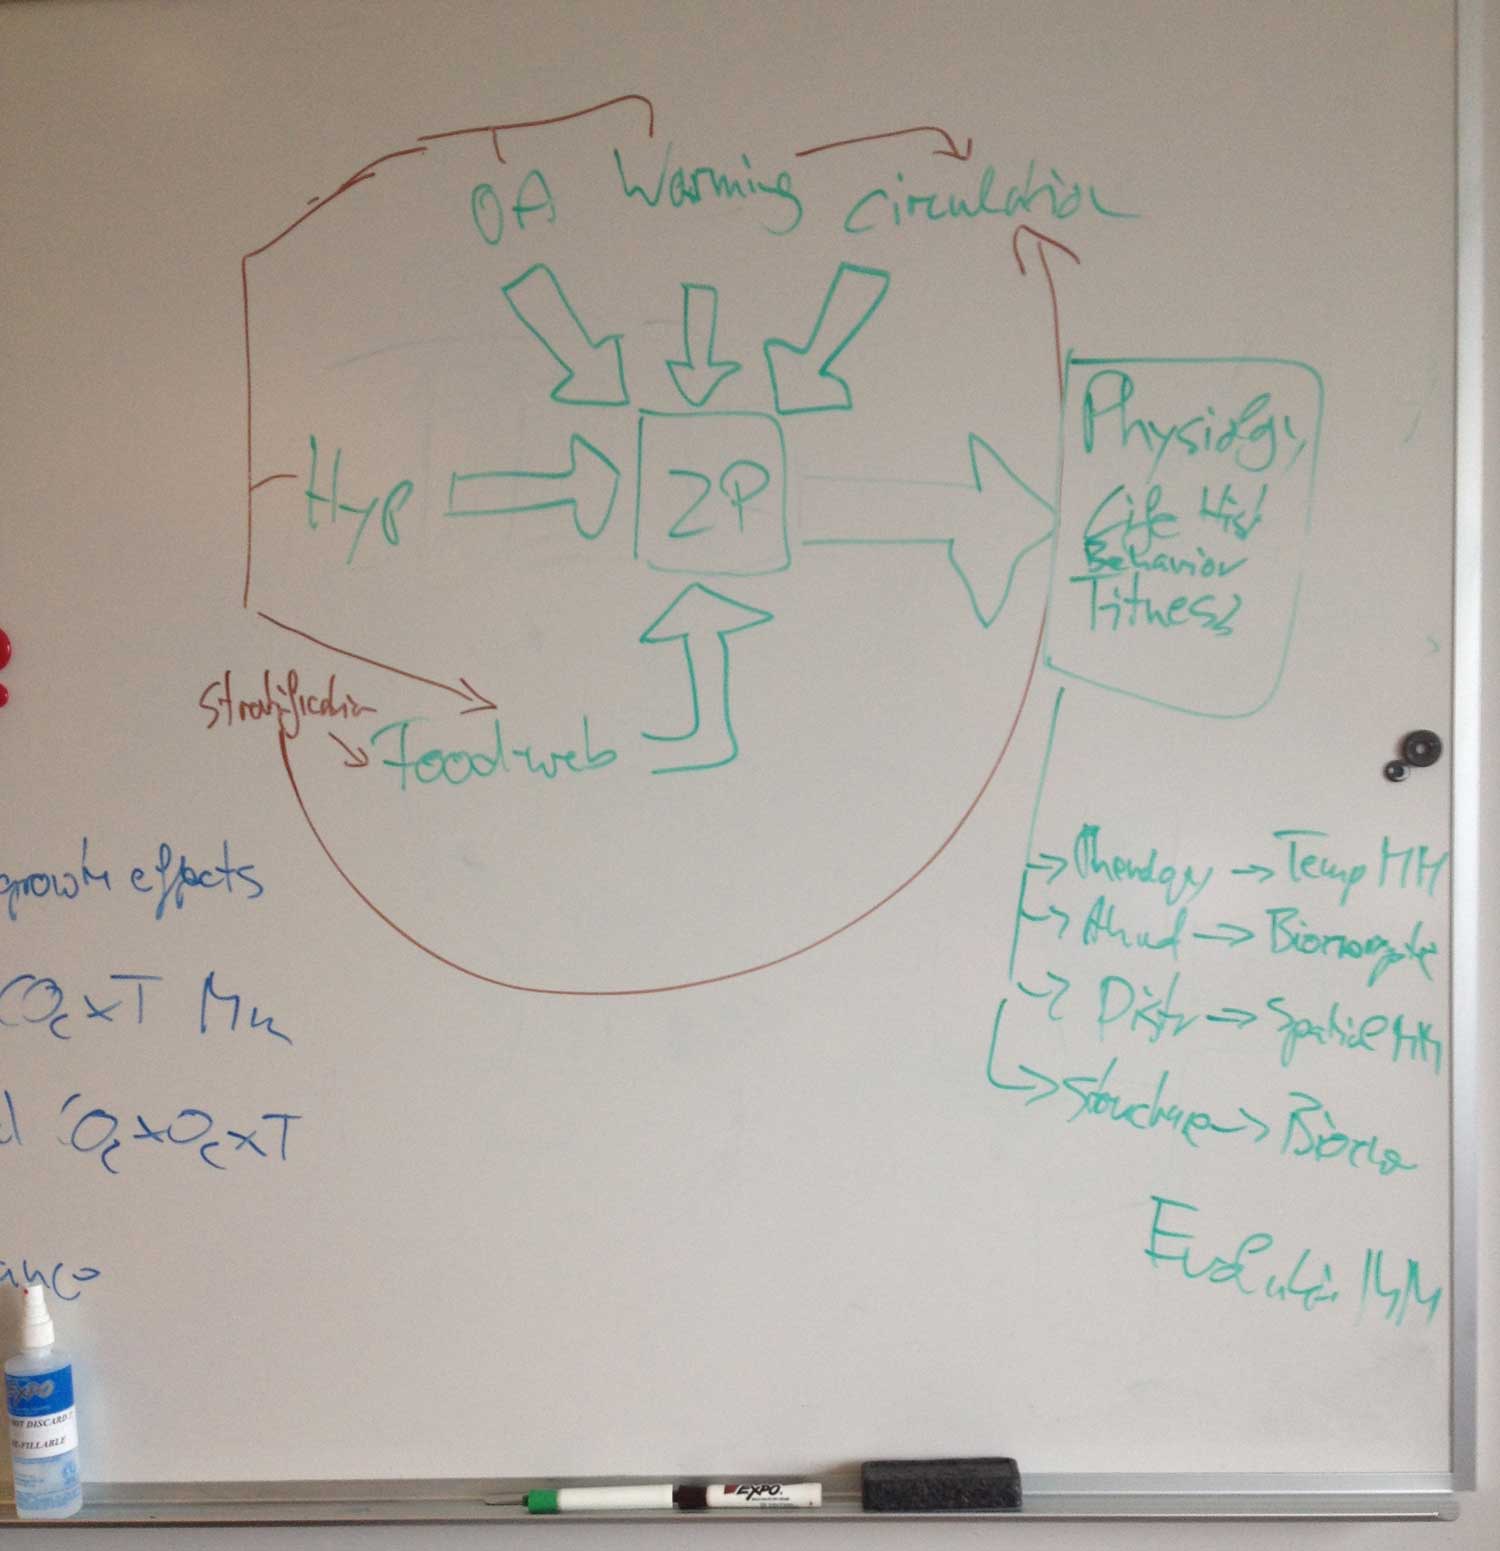
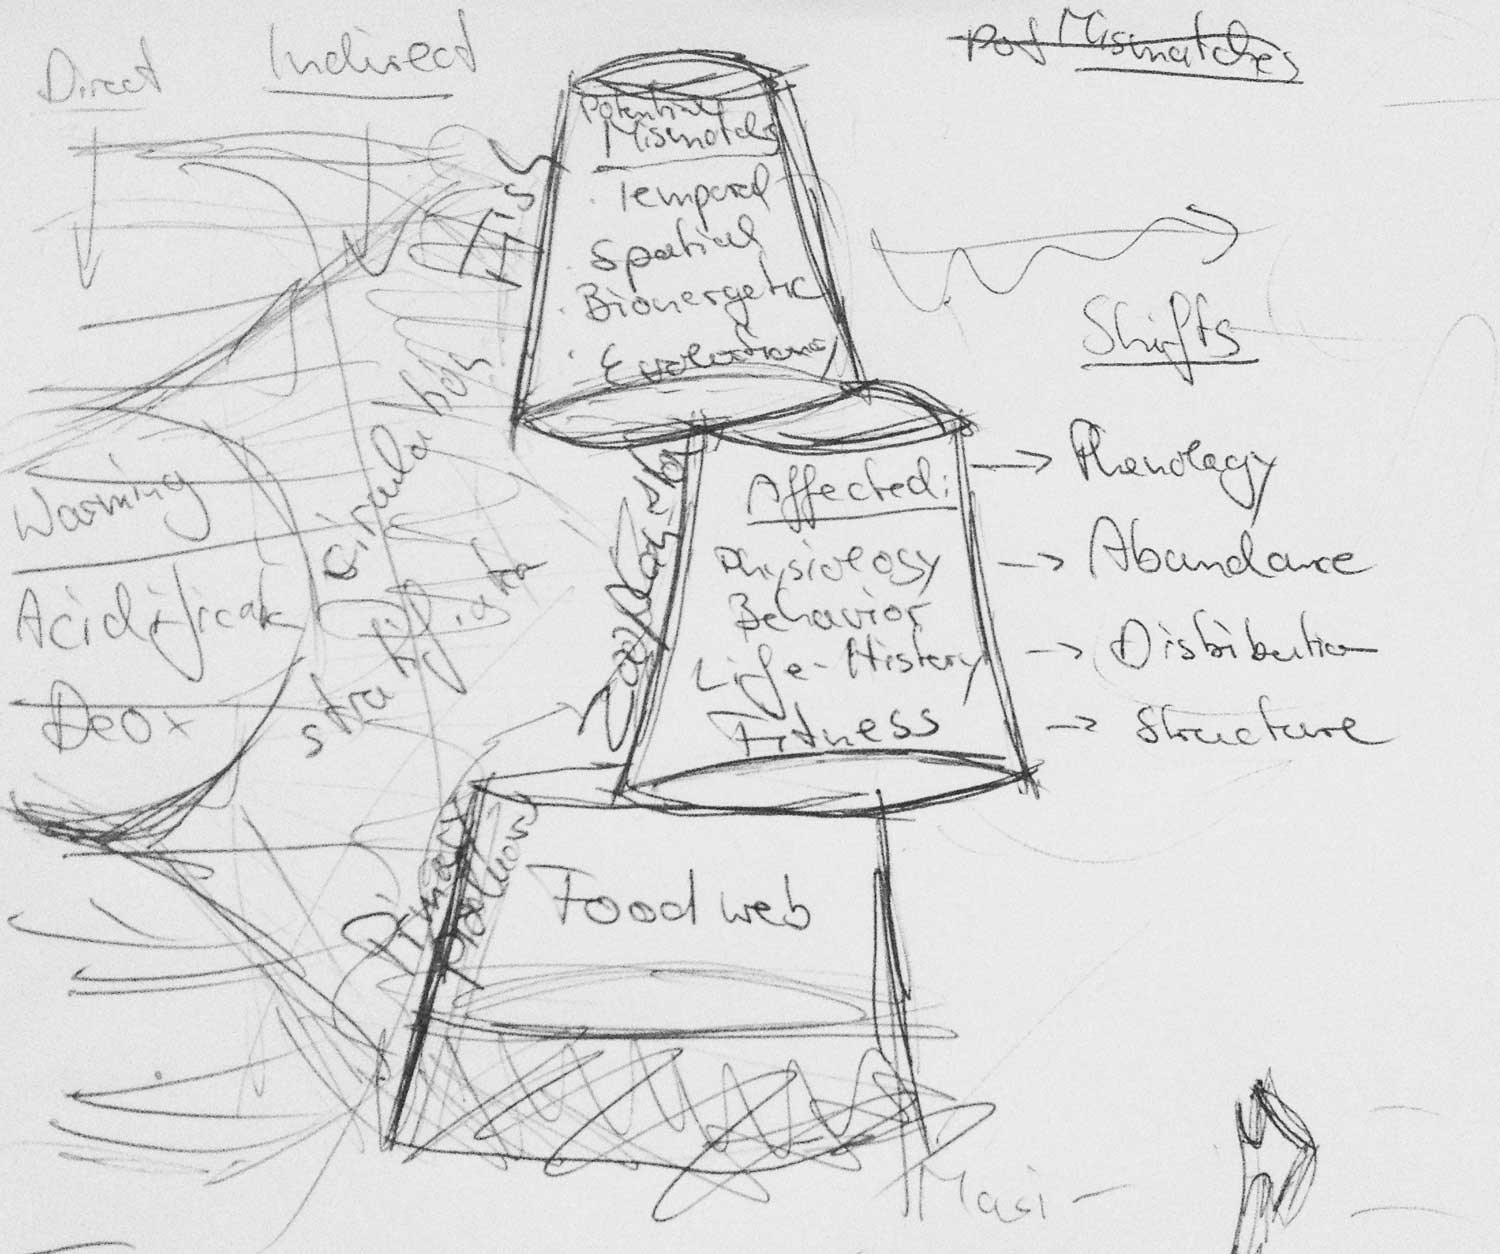
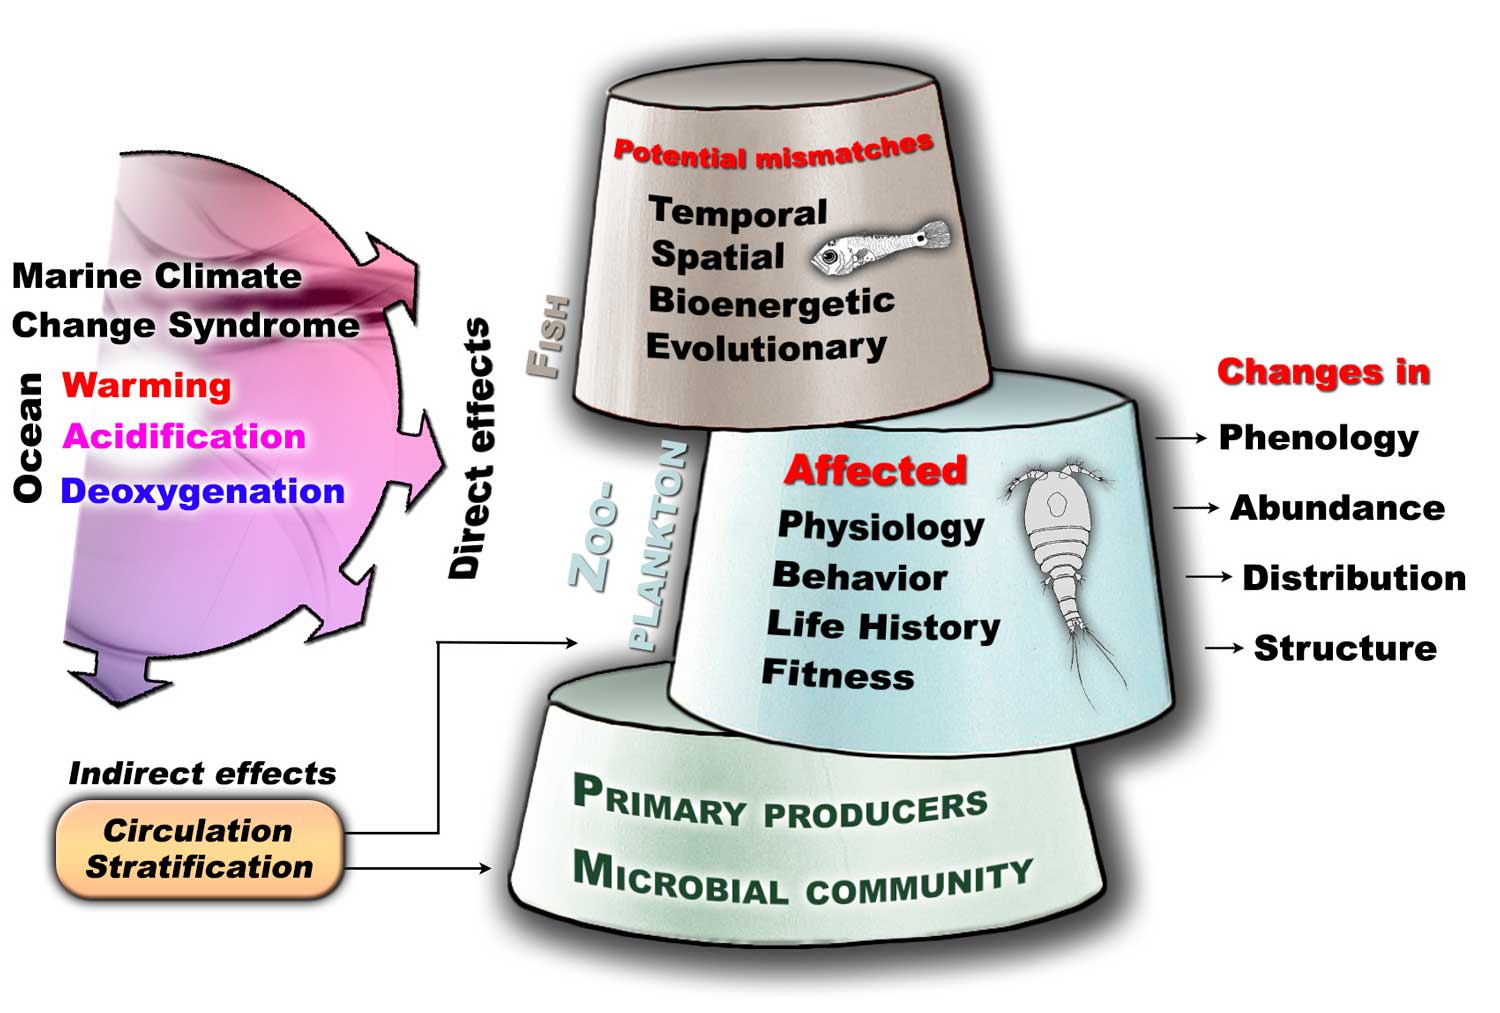
4. Climate change effects on zooplankton and its potential for mismatches with higher trophic levels - a genesis
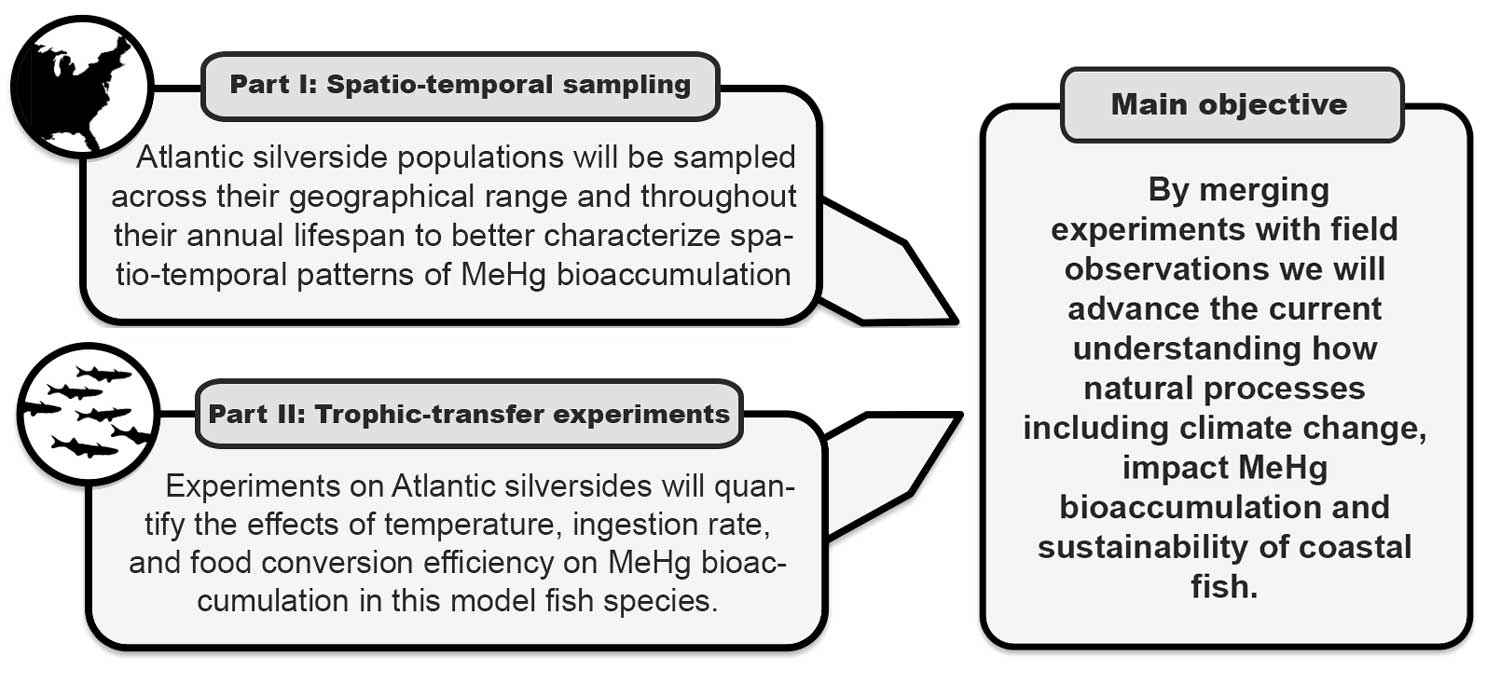
3. Illustration of the structure of a research proposal
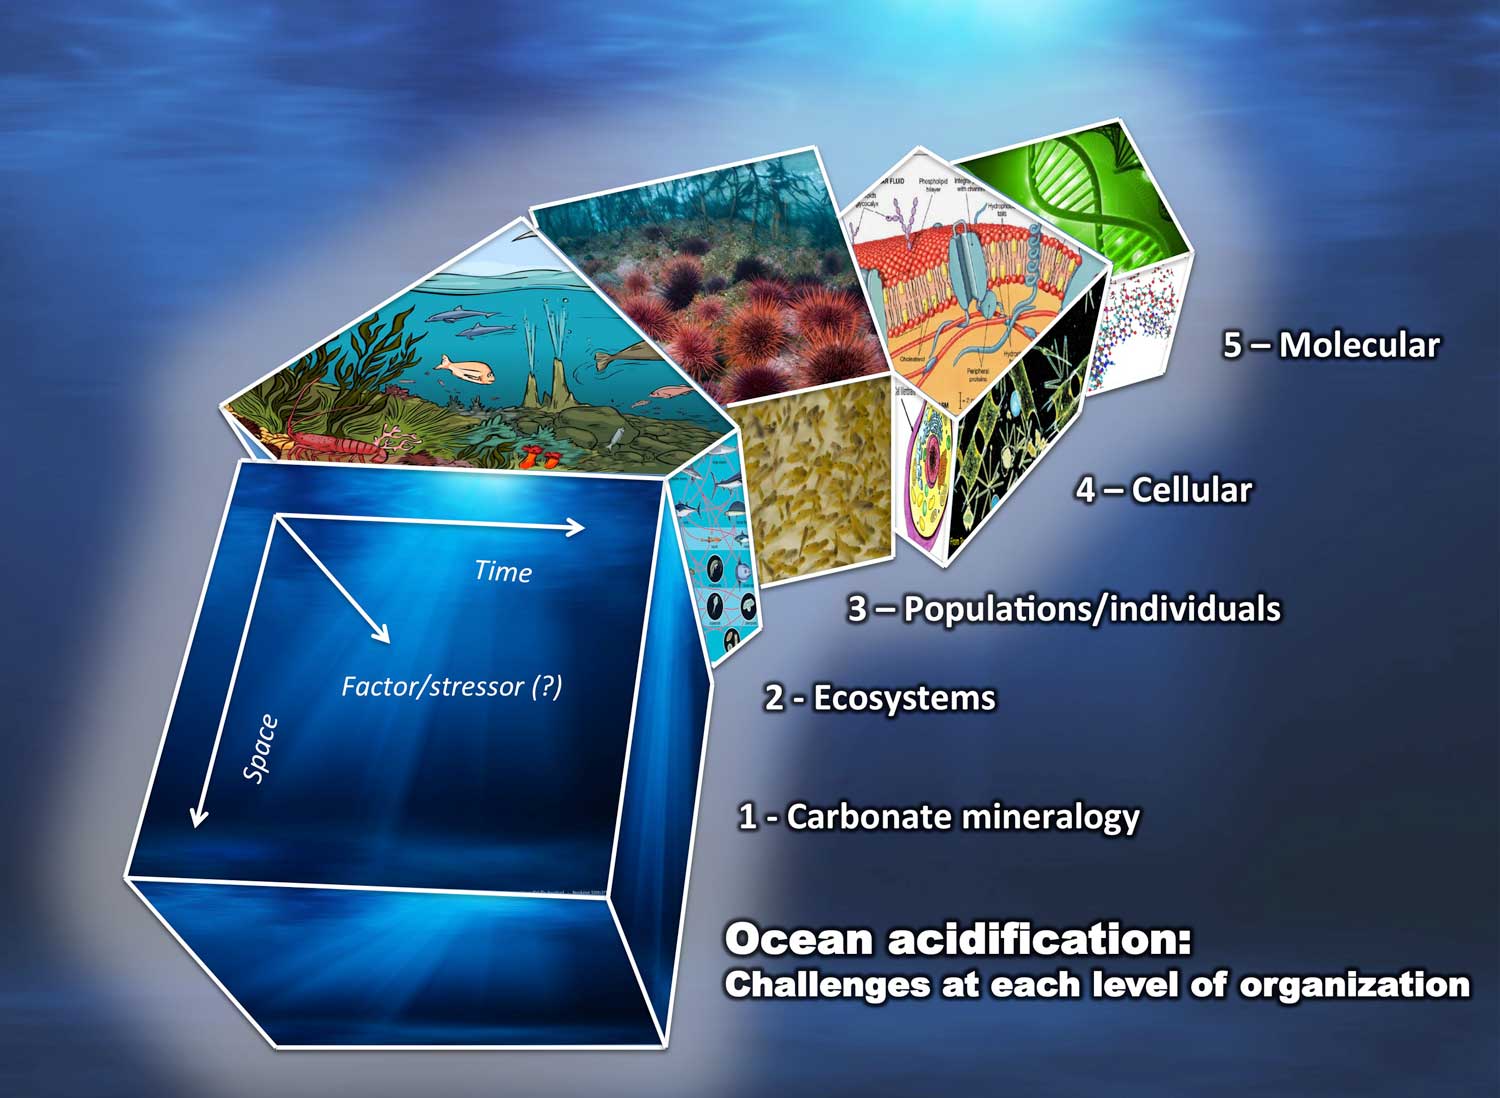
2. Ocean acidification: challenges on each level of organization - a genesis
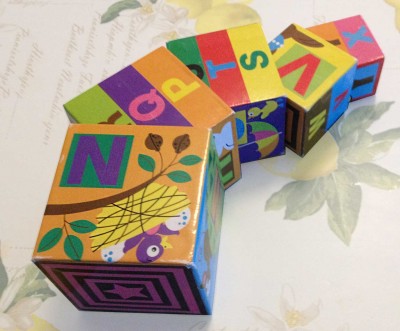
The idea of using cubes to visualize the hierarchical levels of organization came while contemplating the mess in my kids' room, in particular the alphabet cubes strewn on the floor ..."
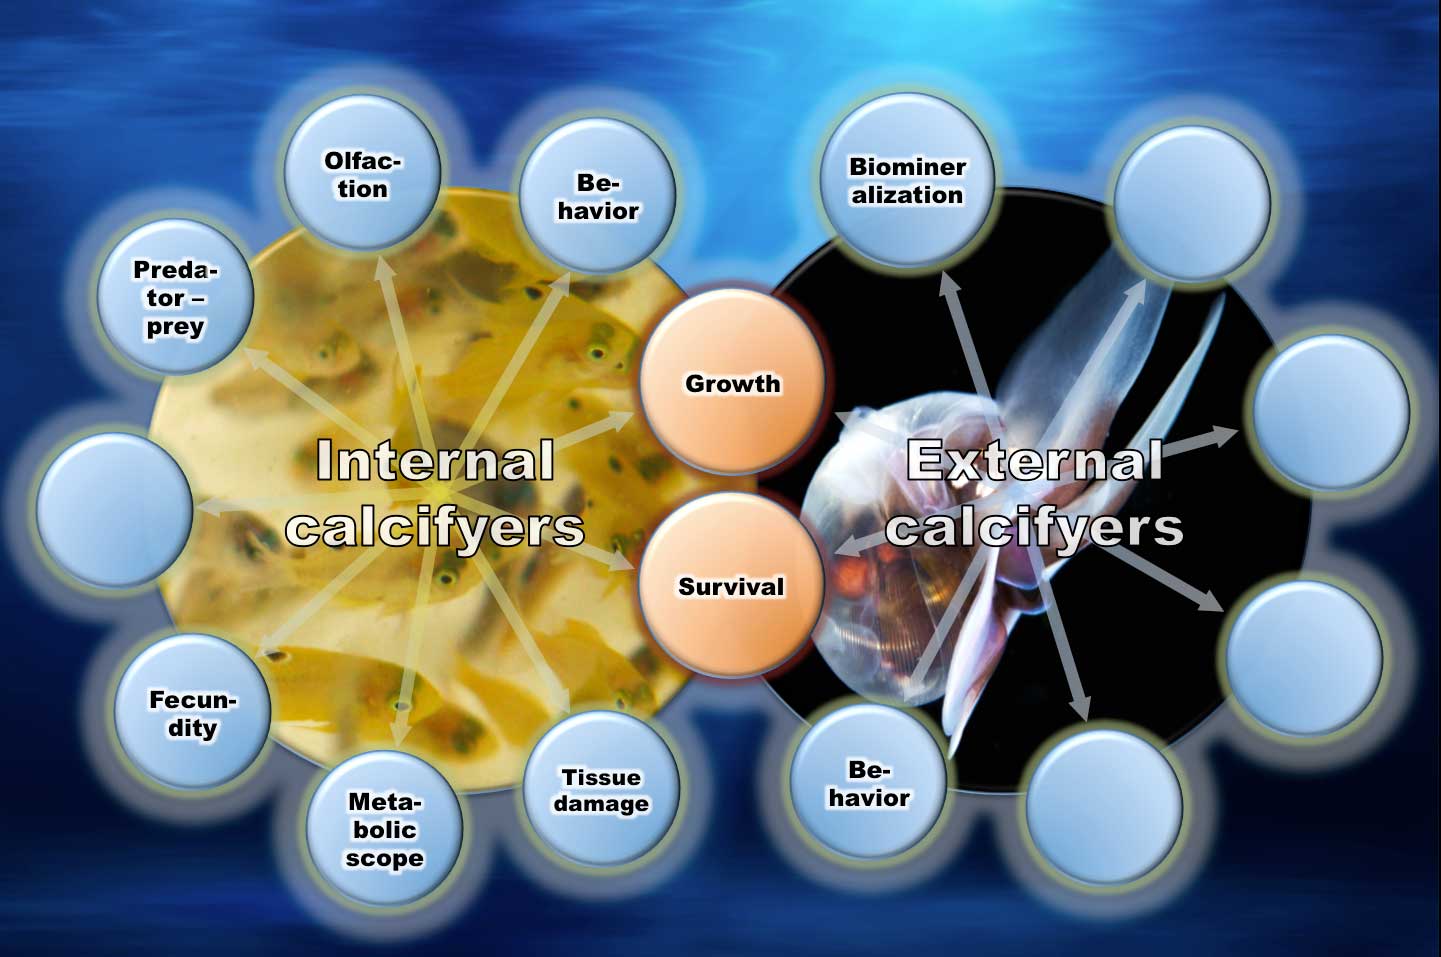
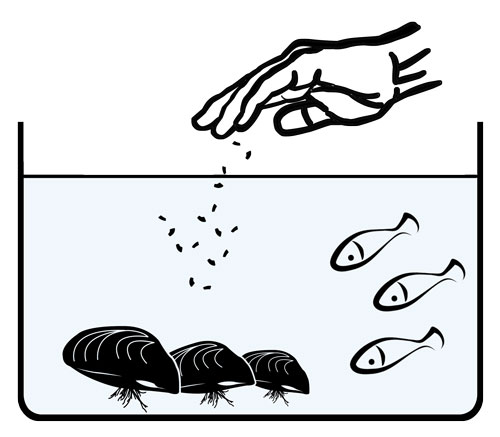
1. Ocean acidification effects on externally vs. internally calcifying organisms