


Web cookies (also called HTTP cookies, browser cookies, or simply cookies) are small pieces of data that websites store on your device (computer, phone, etc.) through your web browser. They are used to remember information about you and your interactions with the site.
Session Management:
Keeping you logged in
Remembering items in a shopping cart
Saving language or theme preferences
Personalization:
Tailoring content or ads based on your previous activity
Tracking & Analytics:
Monitoring browsing behavior for analytics or marketing purposes
Session Cookies:
Temporary; deleted when you close your browser
Used for things like keeping you logged in during a single session
Persistent Cookies:
Stored on your device until they expire or are manually deleted
Used for remembering login credentials, settings, etc.
First-Party Cookies:
Set by the website you're visiting directly
Third-Party Cookies:
Set by other domains (usually advertisers) embedded in the website
Commonly used for tracking across multiple sites
Authentication cookies are a special type of web cookie used to identify and verify a user after they log in to a website or web application.
Once you log in to a site, the server creates an authentication cookie and sends it to your browser. This cookie:
Proves to the website that you're logged in
Prevents you from having to log in again on every page you visit
Can persist across sessions if you select "Remember me"
Typically, it contains:
A unique session ID (not your actual password)
Optional metadata (e.g., expiration time, security flags)
Analytics cookies are cookies used to collect data about how visitors interact with a website. Their primary purpose is to help website owners understand and improve user experience by analyzing things like:
How users navigate the site
Which pages are most/least visited
How long users stay on each page
What device, browser, or location the user is from
Some examples of data analytics cookies may collect:
Page views and time spent on pages
Click paths (how users move from page to page)
Bounce rate (users who leave without interacting)
User demographics (location, language, device)
Referring websites (how users arrived at the site)
Here’s how you can disable cookies in common browsers:
Open Chrome and click the three vertical dots in the top-right corner.
Go to Settings > Privacy and security > Cookies and other site data.
Choose your preferred option:
Block all cookies (not recommended, can break most websites).
Block third-party cookies (can block ads and tracking cookies).
Open Firefox and click the three horizontal lines in the top-right corner.
Go to Settings > Privacy & Security.
Under the Enhanced Tracking Protection section, choose Strict to block most cookies or Custom to manually choose which cookies to block.
Open Safari and click Safari in the top-left corner of the screen.
Go to Preferences > Privacy.
Check Block all cookies to stop all cookies, or select options to block third-party cookies.
Open Edge and click the three horizontal dots in the top-right corner.
Go to Settings > Privacy, search, and services > Cookies and site permissions.
Select your cookie settings from there, including blocking all cookies or blocking third-party cookies.
For Safari on iOS: Go to Settings > Safari > Privacy & Security > Block All Cookies.
For Chrome on Android: Open the app, tap the three dots, go to Settings > Privacy and security > Cookies.
Disabling cookies can make your online experience more difficult. Some websites may not load properly, or you may be logged out frequently. Also, certain features may not work as expected.
Home | Introduction | Mumford Cove | Methods | Data - Seasonal - Diel/tidal - Interannual variability | References
"Large, manmade changes to Earth’s climate and ecosystems are unfolding all around us. On geological time scales, their pace is unprecedented, but for humans they feel incremental or aren't noticeable because of nature’s fluctuations from year to year, between seasons, day and night, or even from one tide to the next. But when we record nature, when we measure its variable, dynamic states with diligence and dedication across days, years, decades, and centuries, we see the irrefutable scientific proof of longer-term, large-scale patterns.
And yet, the practice of regular environmental measurements, or monitoring, is inherently of little to no short-term benefit to the people who practice it. It is work without immediate reward and therefore often a challenge to fund and conduct. Instead, what powers it is often just the prescient understanding of individuals or organizations that future generations will certainly have better theories, tools, models, and computers, but they will still depend on the data and measurements taken here and now."
In 1886, almost 140 years ago, a man walked down a pier in Woods Hole (MA) and stuck a thermometer in the water. Then did so again and again, every day. The people after him kept at it, and this is why we know today how the waters around Cape Cod have warmed throughout the last century (Nixon et al. 2004).
More famously, in 1958 Charles D. Keeling began measuring carbon dioxide (CO2) concentrations on top of Hawaii’s Mauna Loa and persisted through decades of adversity and despite no apparent short-term reward. Today, Keeling’s eponymous curve – proving the inexorable, man-made rise of climate-warming CO2 in our atmosphere - stands as one of the greatest inspiring examples for the importance of environmental monitoring.
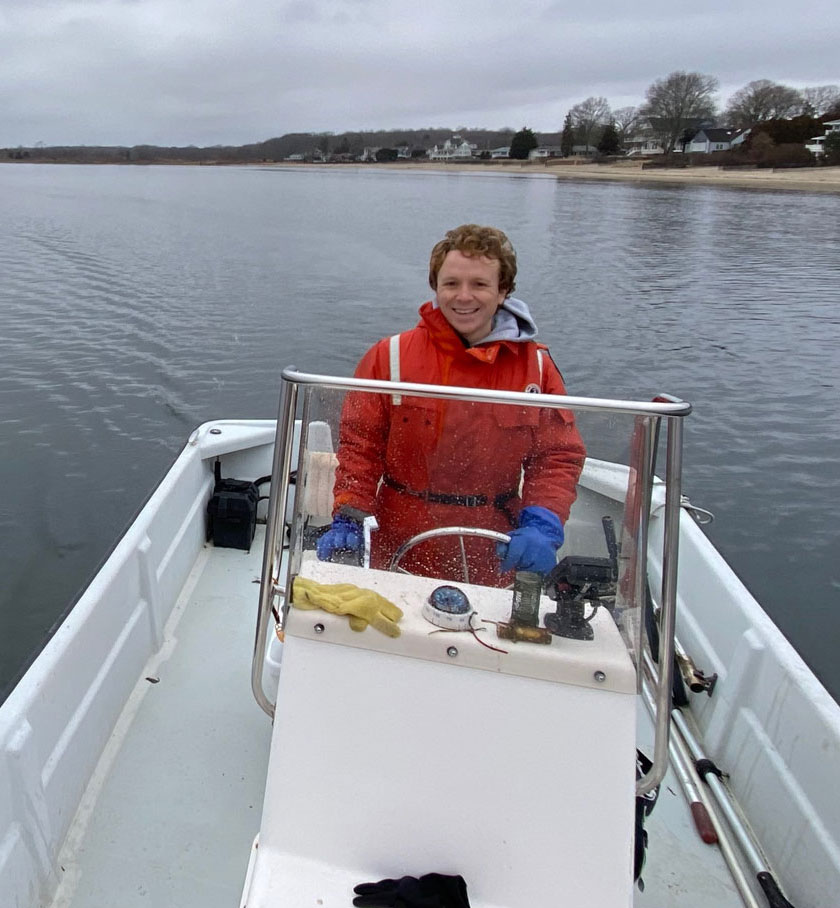
When Hannes Baumann joined the Department of Marine Sciences at the University of Connecticut Avery Point in fall 2014, he searched for a nearby field site to study and collect experimental organisms.
Mumford Cove, a little embayment nestled between a state park and a small beach community, turned out to be perfect for his research.
And because of his long-standing interest in climate change effects and previous work on environmental time-series, he immediately wanted to start a monitoring time-series, too, using his start-up funds to purchase the first temperature, pH, and oxygen loggers. The Evolutionary Fish Ecology Lab has maintained this monitoring time-series now for the past 7 years - unfunded - but true to the prescient spirit of monitoring nature today – so that later generations can reap the knowledge rewards later.
Home | Introduction | Mumford Cove | Methods | Data - Seasonal - Diel/tidal - Interannual variability | References
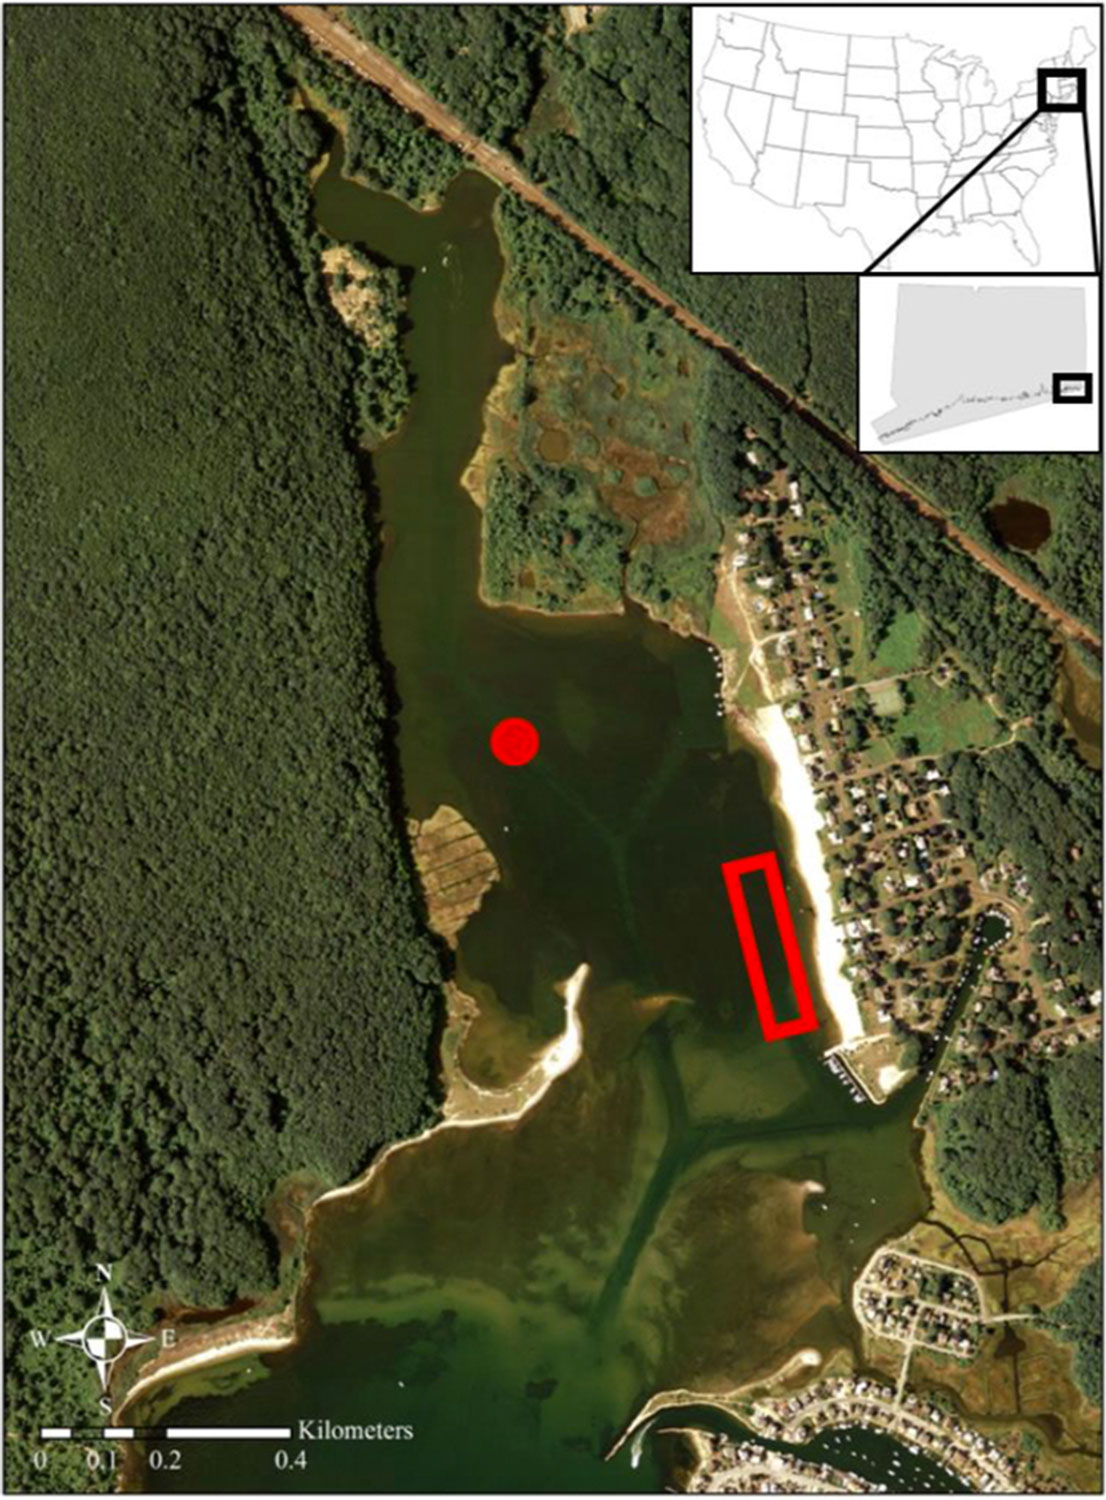
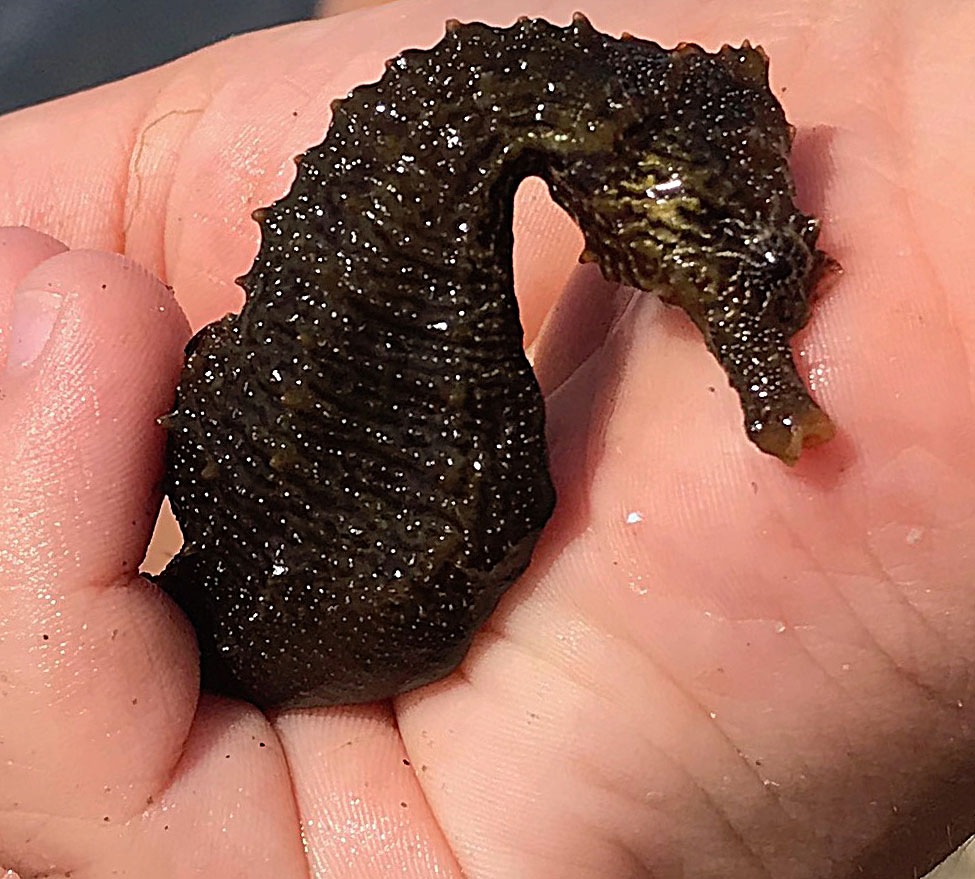
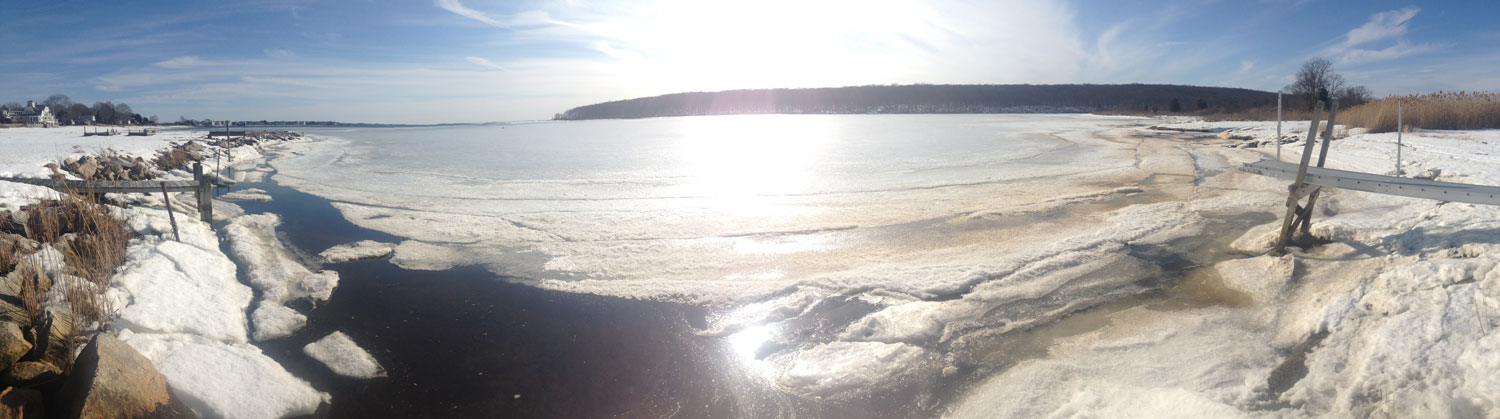
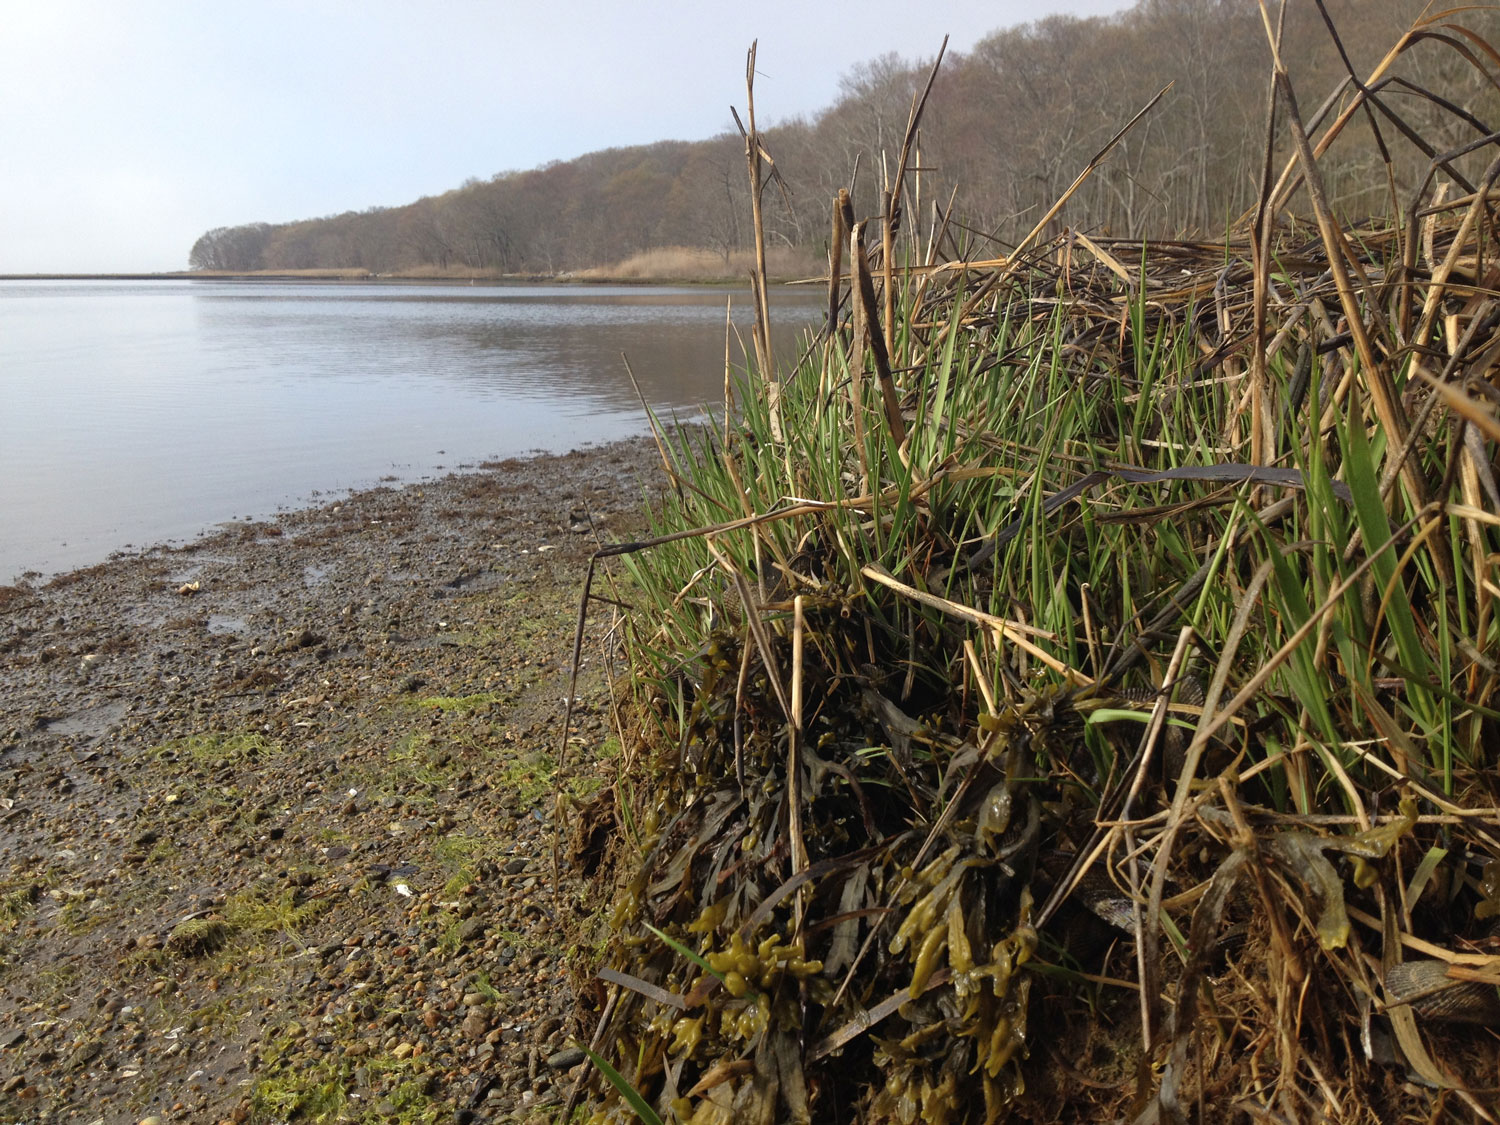
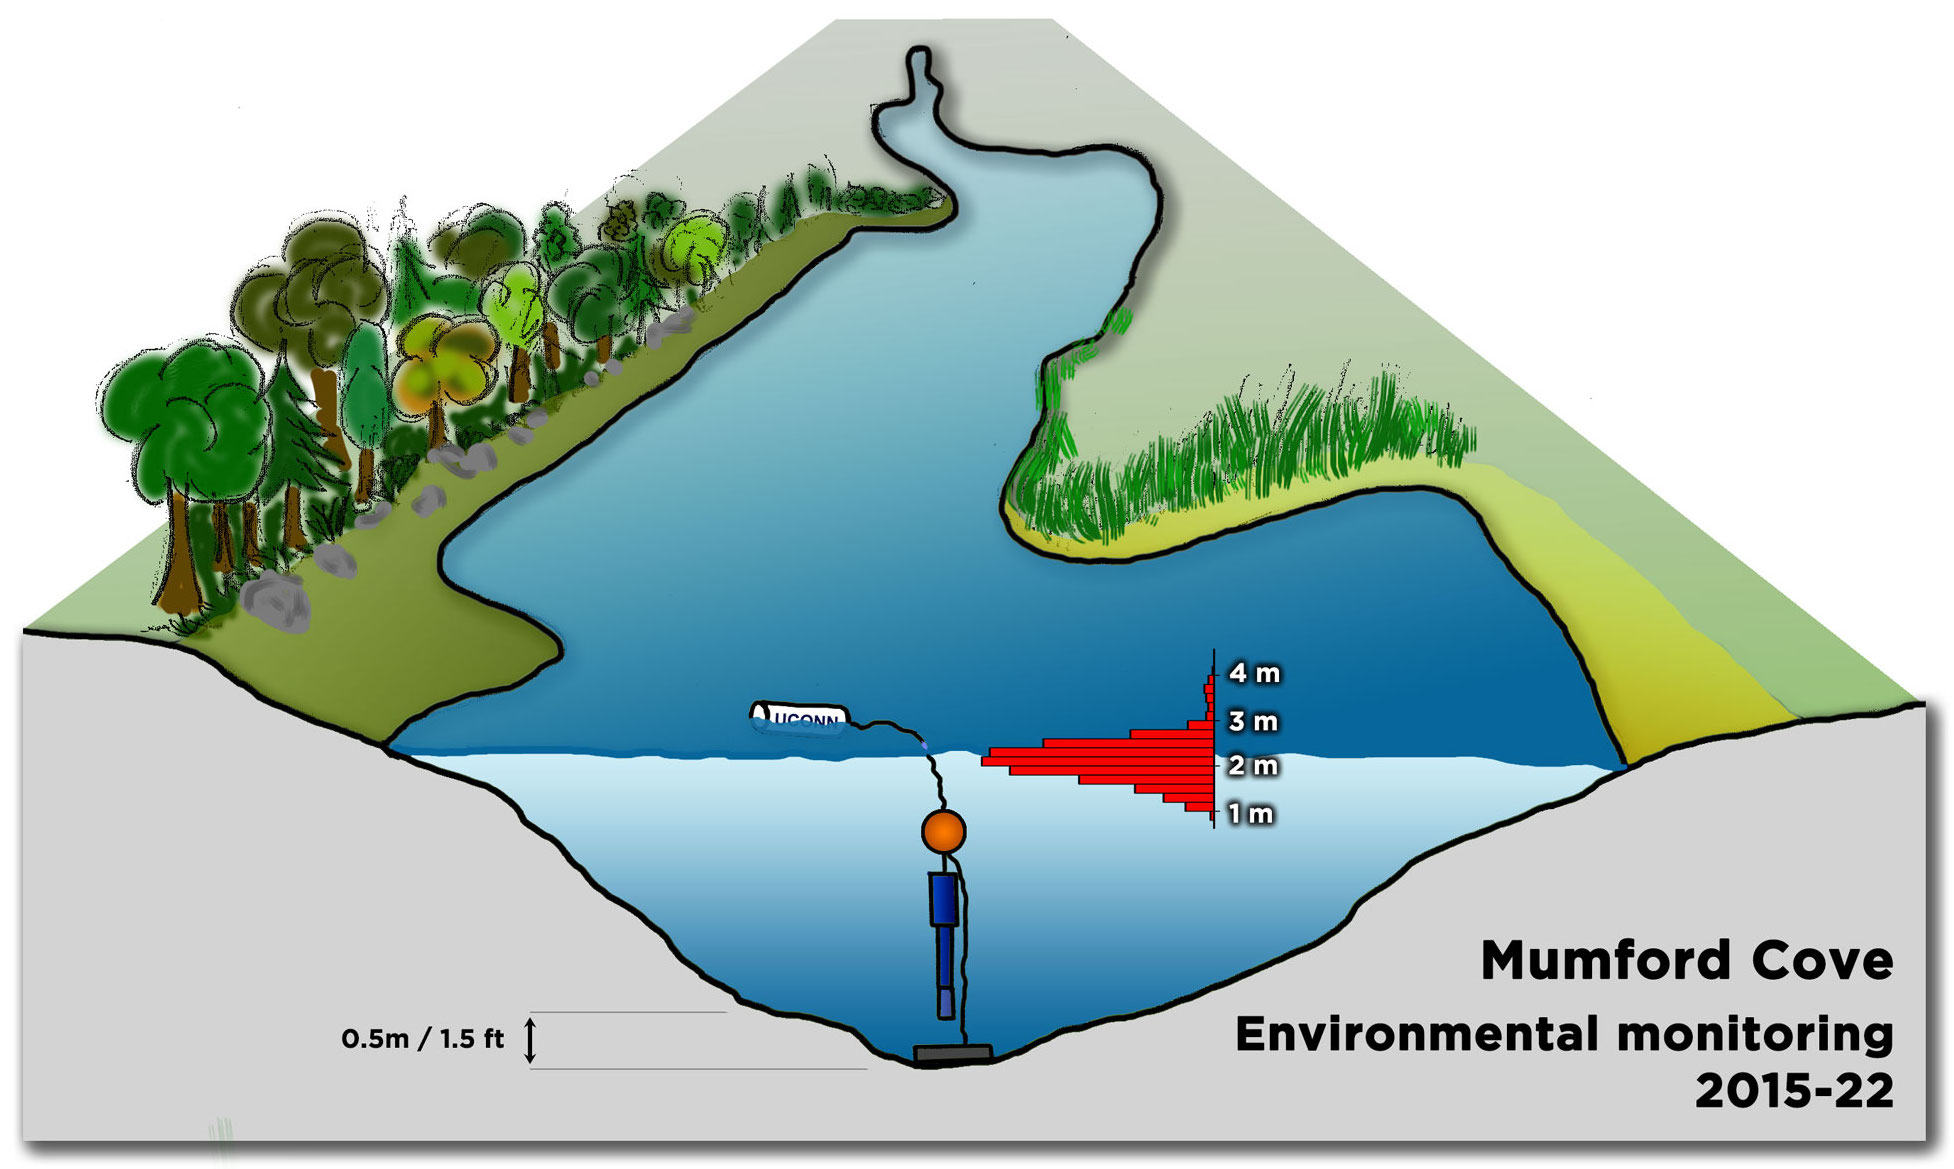
Nestled between Bluff Point State Park to the west and Groton Long Point to the east, the 48 ha (~0.5 km2) small Mumford Cove (41.32°N, 72.02°W) lays where Long Island Sound opens into the Atlantic Ocean at Fisher’s Island Sound. It is a shallow embayment (~1m) with negligible freshwater input, dominated by semi-diurnal lunar tides (~0.8m) that flush through an inlet flanked by sand bars. This tidal flushing creates dynamic fluctuations of temperature, pH, and dissolved oxygen conditions, which are typical for many nearshore marine habitats. Marsh grass (Spartina spp), rocky sections, and a small beach surround the Cove, while dense eelgrass (Zostera marina) covers its shallow bottom and thereby provides ideal habitat for juvenile fish, shellfish, and other marine organisms.
Just a few decades ago, the Cove looked very different. Until 1987, a wastewater treatment plant discharged its effluent directly into it, and the turbid water covered a bottom dominated by macroalgae (Ulva spp) instead of eelgrass. After citizens forced the redirection of municipal wastewater, Mumford Cove’s eelgrass recovered, making it one of the most stunning recovery examples in Long Island Sound therefore an important site for research and conservation (Vaudrey et al. 2010). Biological and physical oceanographers from the Department of Marine Sciences have studied Mumford Cove for years, and since 2022, it has become part of the newly established Connecticut National Estuarine Research Reserve. Due to its location and unique characteristics, Mumford Cove may be an important sentinel site for documenting climate-change related shifts in species occurring in Long Island Sound.
Home | Introduction | Mumford Cove | Methods | Data - Seasonal - Diel/tidal - Interannual variability | References
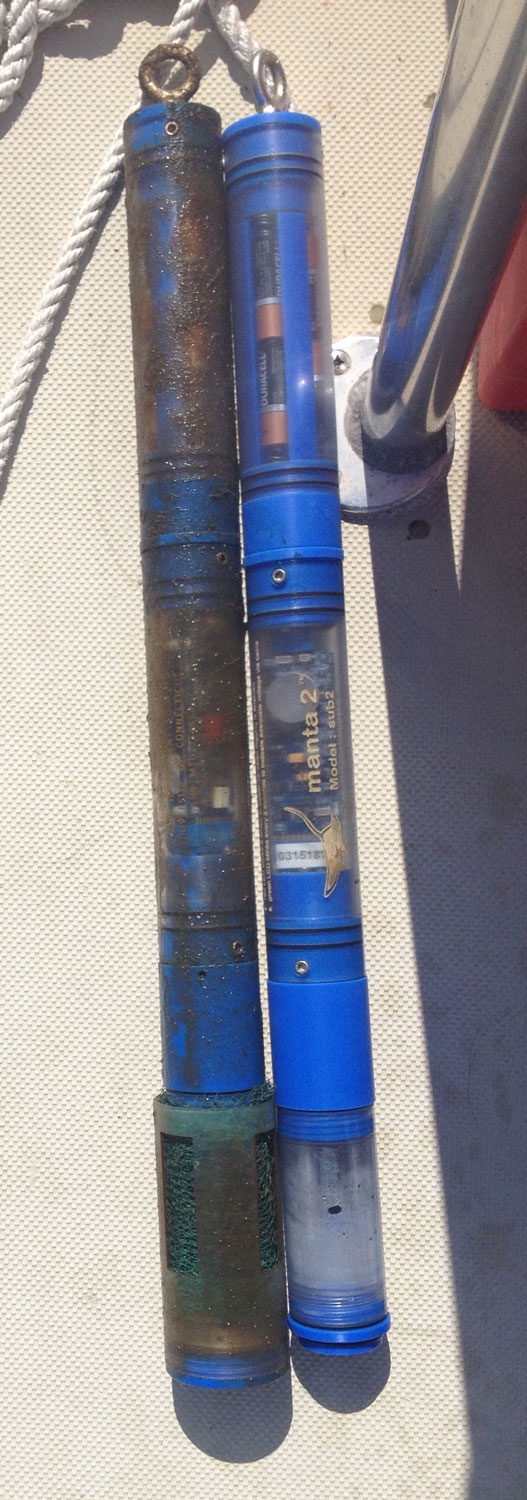
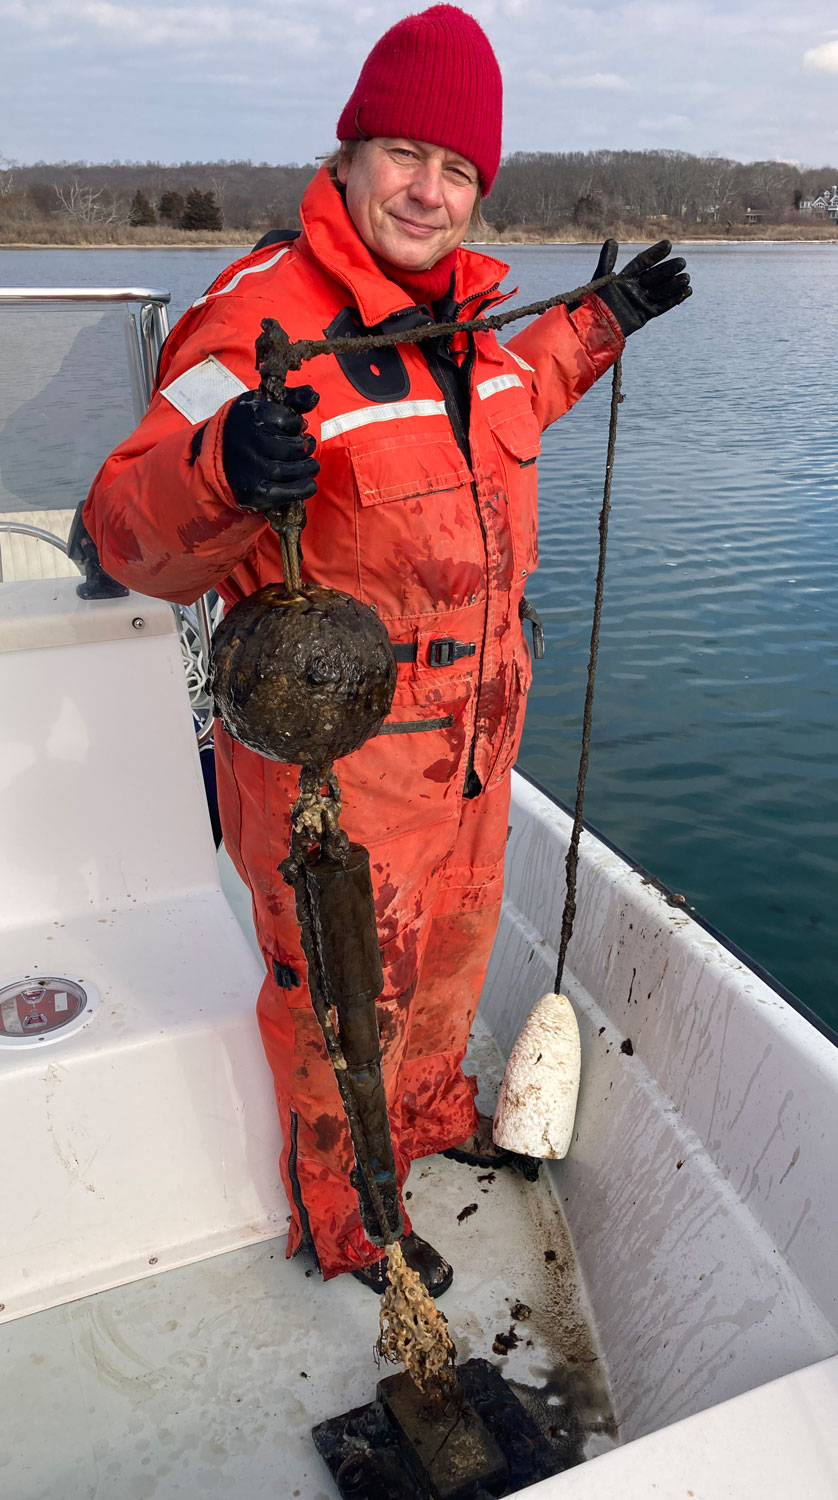
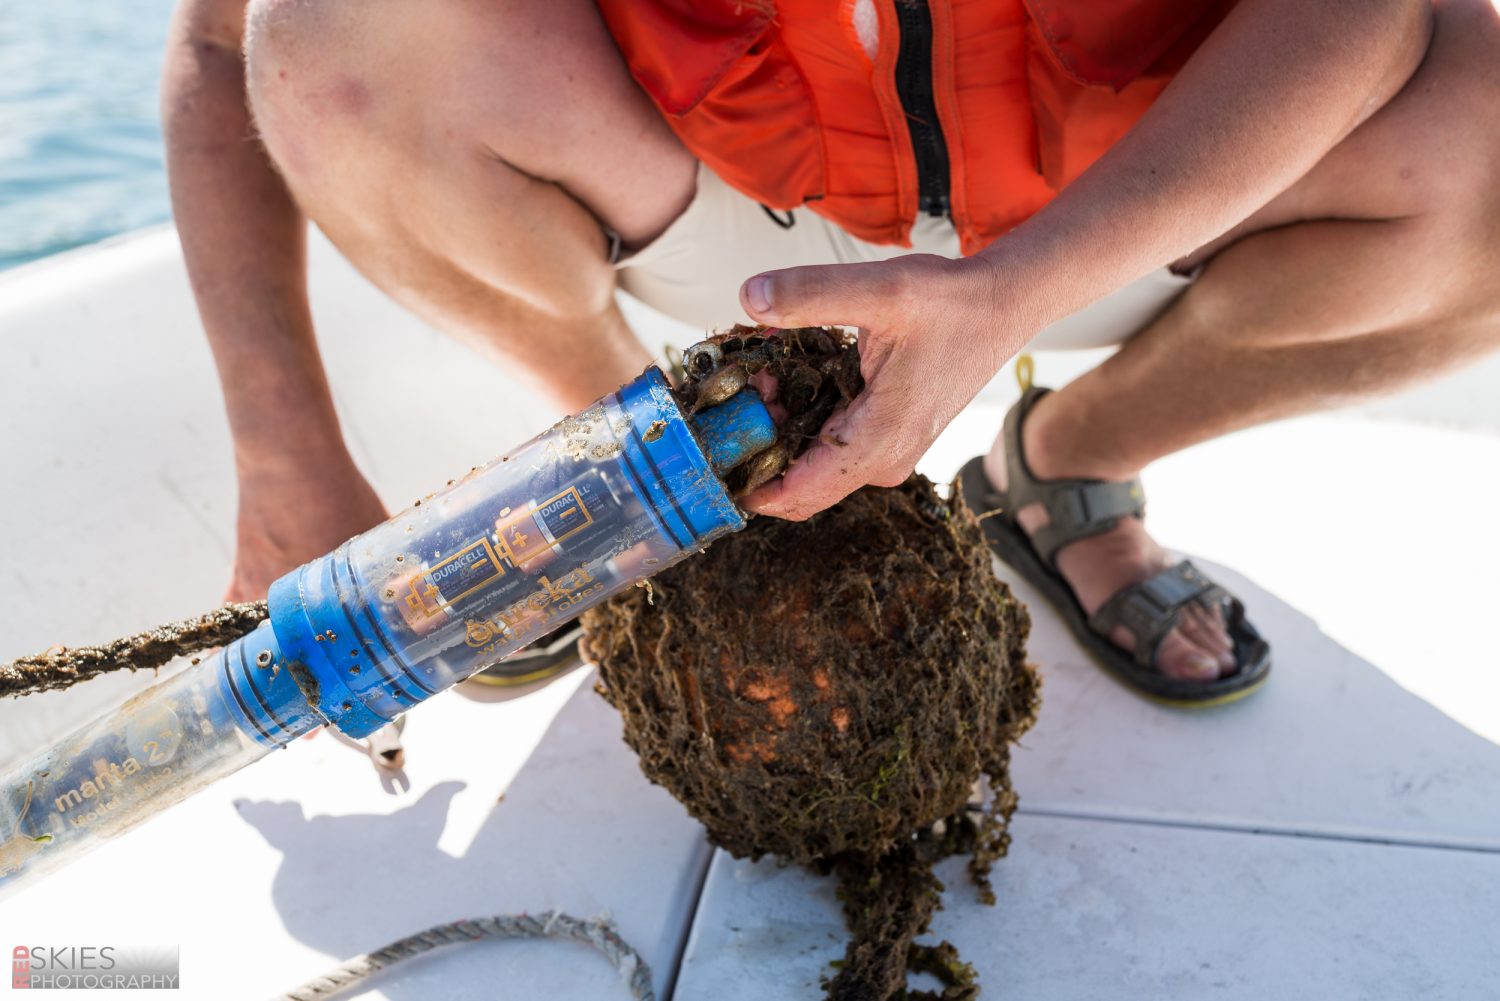
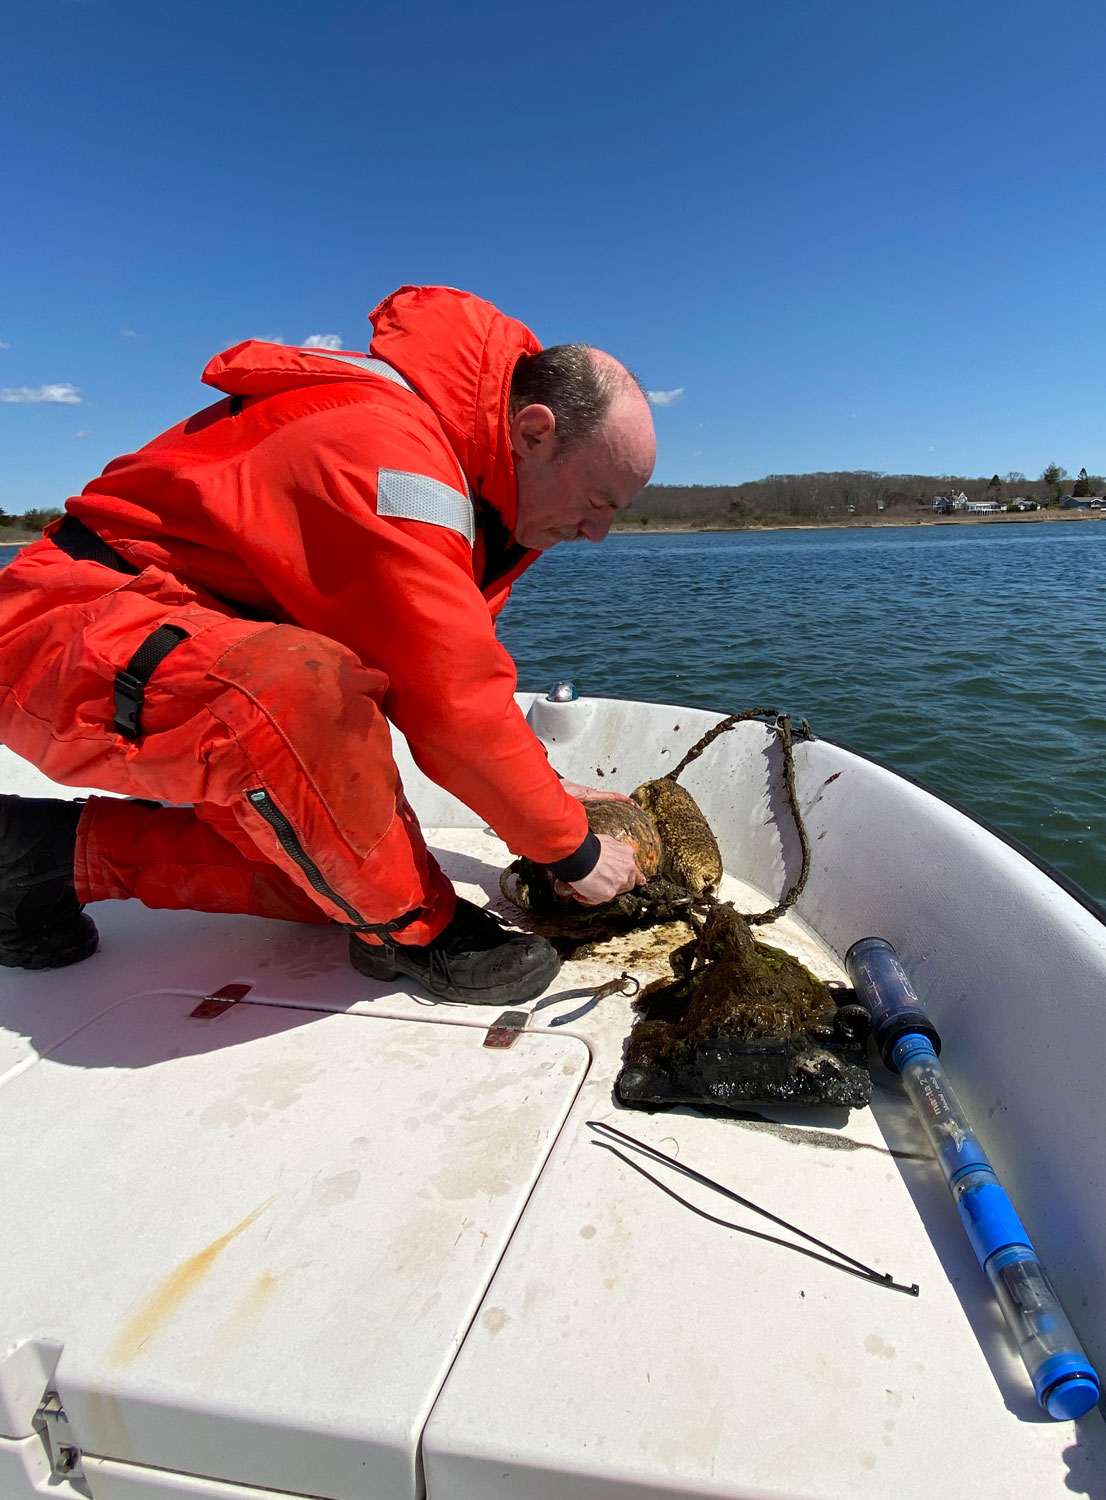
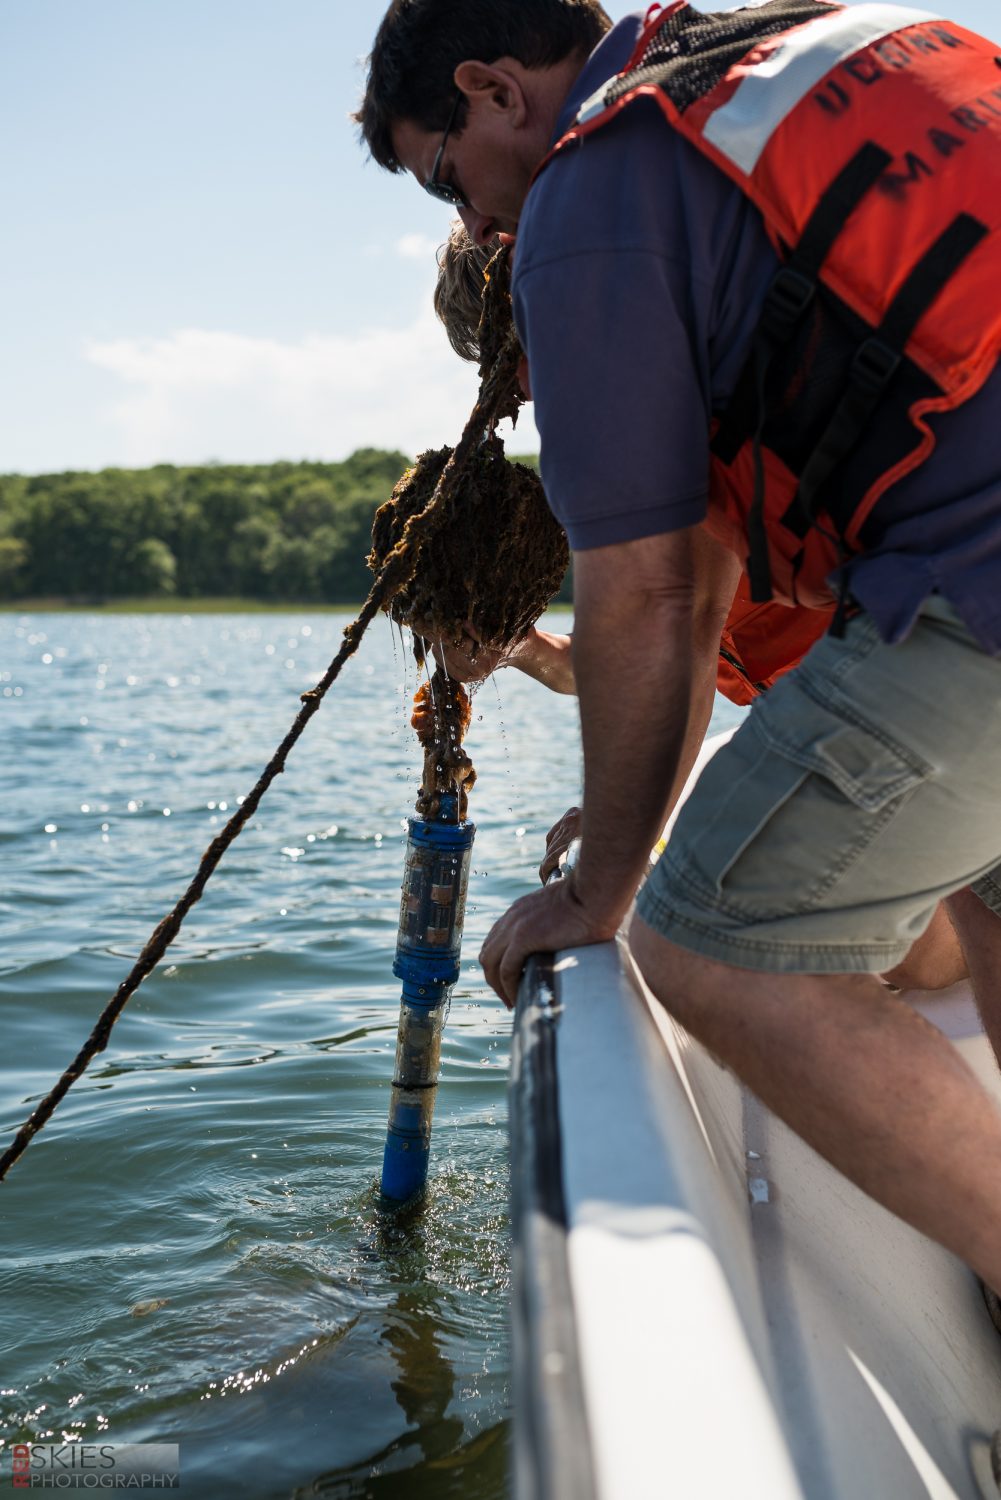
Since April 2015 and as of December 2022, we measured environmental parameters ~ 120,000 times, using battery-operated Eureka Manta Sub2 probes with temperature (°C), pH, dissolved oxygen (mg l-1, % saturation), salinity (psu), and depth (m) sensors recording these parameters in 30 min intervals (48 measurements per day, 17,520 per year). A typical deployment lasts 4-6 weeks for each probe, after which one probe is retrieved and swapped out for a new probe. When in the water, the sensors are surrounded by a copper mesh guard that protects against biofouling.
All probes are meticulously calibrated pre- and post-deployment, using National Institute of Standards and Technology (NIST) pH standards (pH4, pH7, pH10) and Ricco conductivity standards (50,000 µS/cm). Our monitoring probe is tethered vertically to a line between a bottom anchor and a sub-surface float so that the sensors are at a constant distance of 50 cm to the bottom, while the water level above the sensor varies with wind and tides (1-4m, mean 2m). A small surface float marks the sensor’s position for retrieval (Fig.1).
After retrieval, probes and sensors are cleaned, data downloaded and then subjected to quality control procedures that include pH drift correction. Data are periodically uploaded to the BCO-DMO database, where the dataset can be found under the digital object identifier 10.26008/1912/bco-dmo.659874.2.
Apart from the PI, all graduate students of the Baumann Lab have helped maintain the monitoring effort throughout the years.
Home | Introduction | Mumford Cove | Methods | Data - Seasonal - Diel/tidal - Interannual variability | References

MatLab animation of high-frequency temperature (red, 20.7-28.3°C), pH (green, 7.3-8.1 pH units), and dissolved oxygen (blue, 13-152%) measurements between 10 July - 31 August 2022 in Mumford Cove. Tick marks along the X-axis correspond to 5 days.
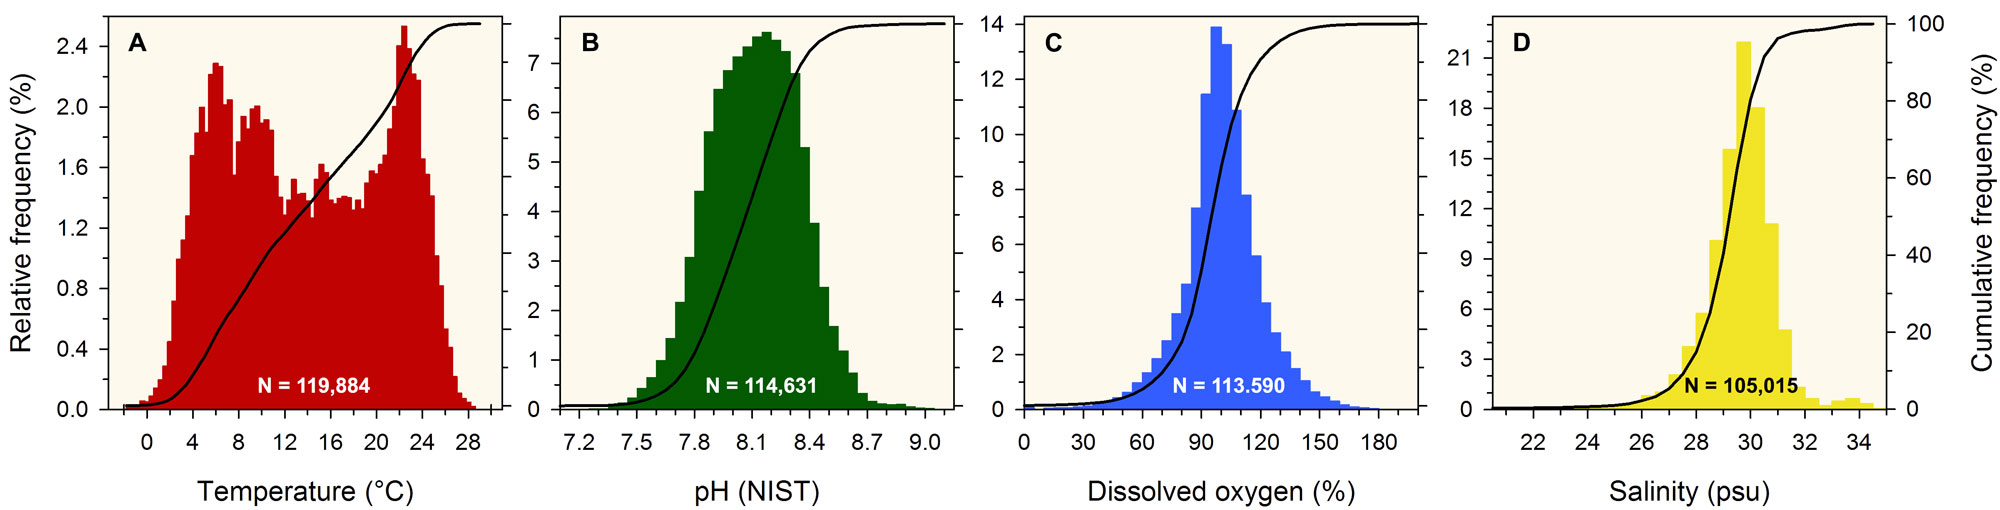
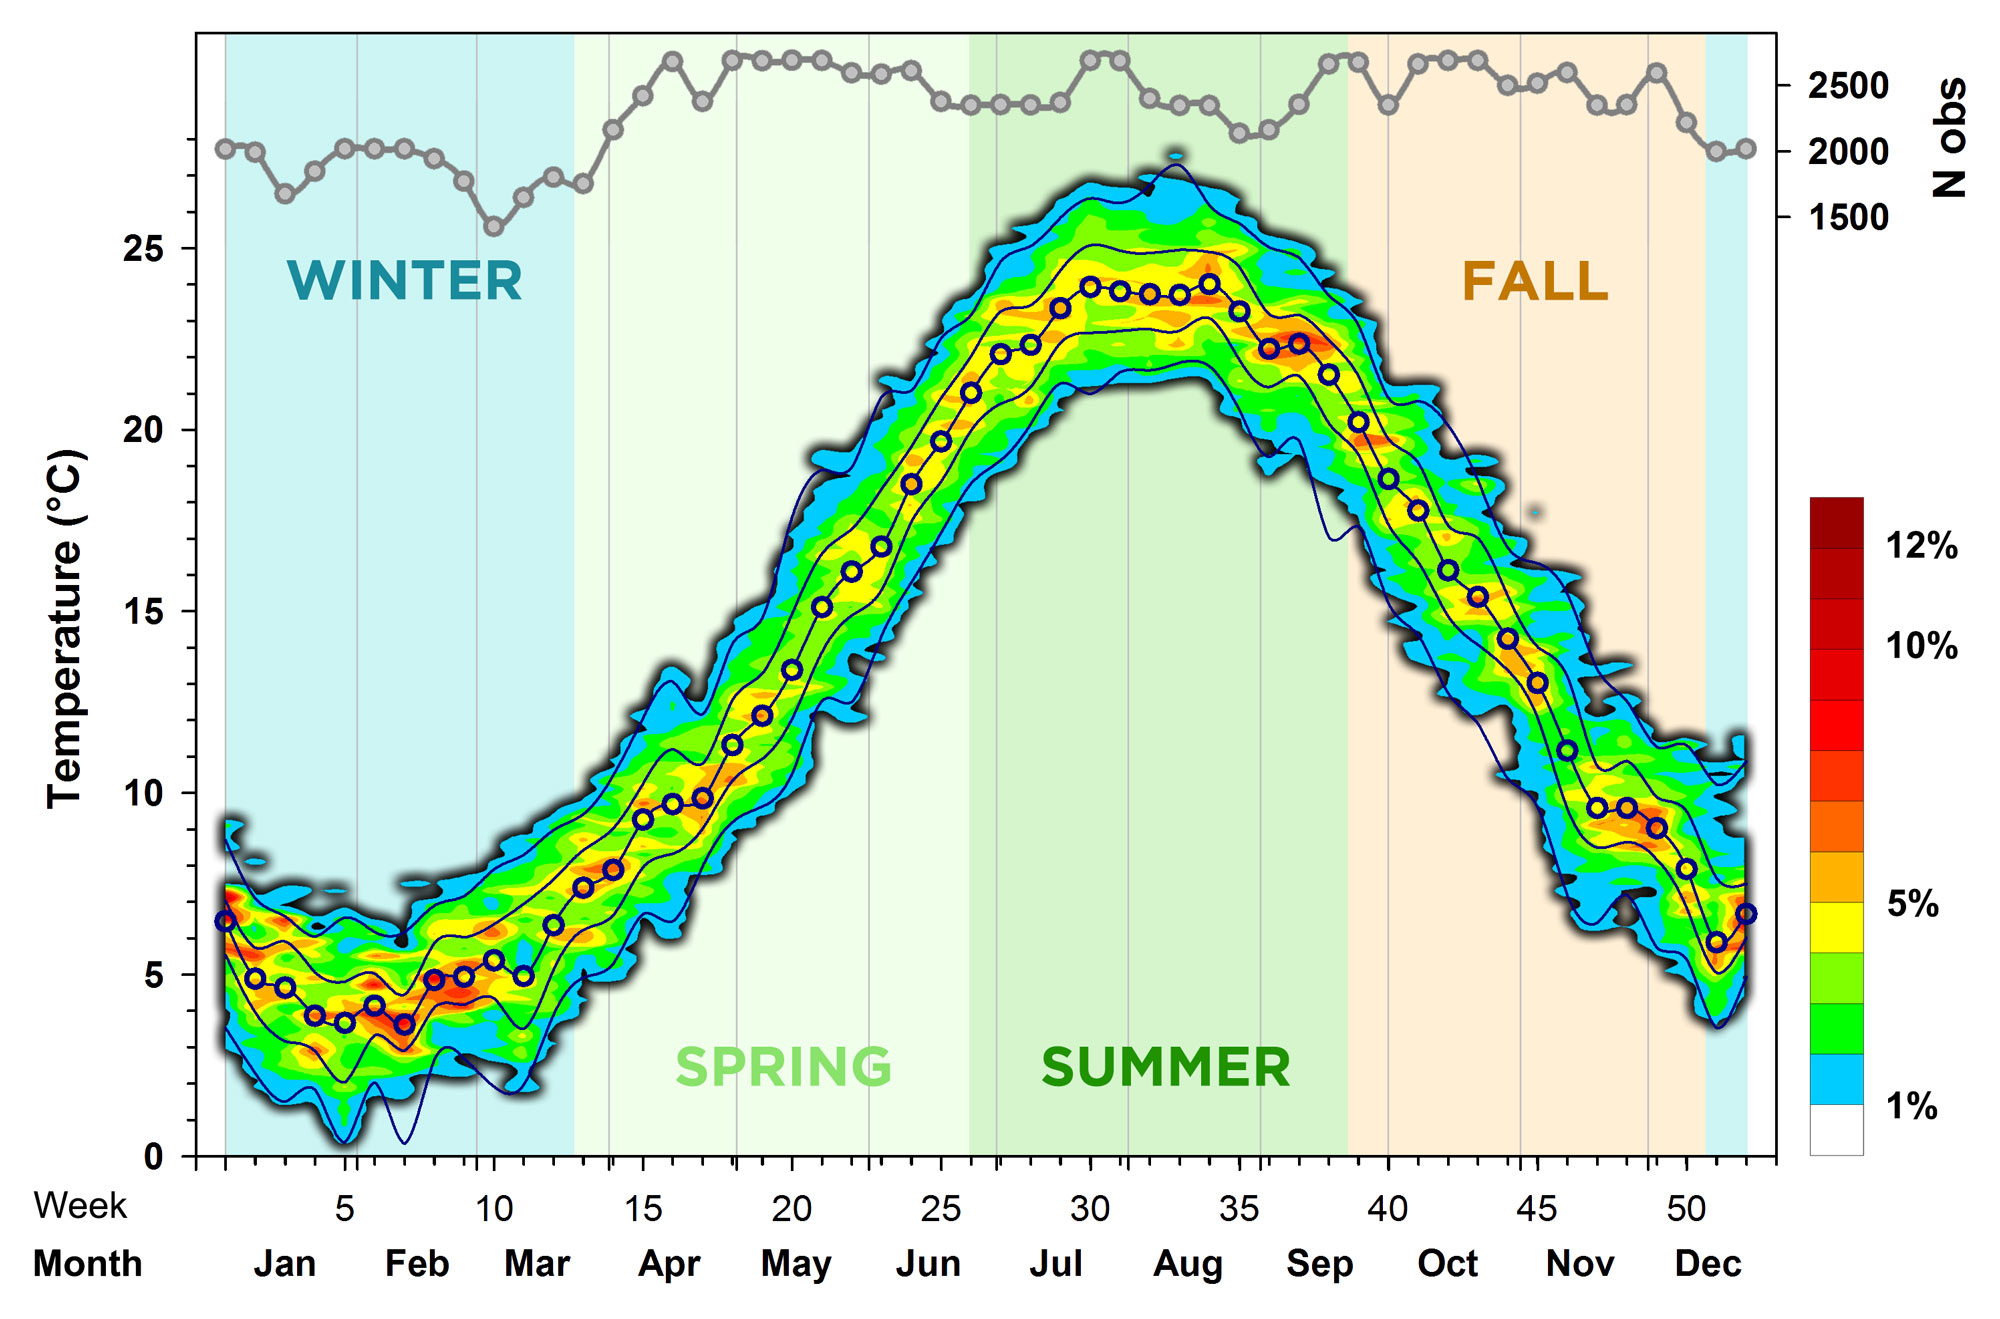
For a first overall look at the seasonal temperature pattern, we binned the variable into 0.4°C increments (=bins) and then counted all measurements in each bin for each week of the year (across all years). These absolute numbers were then transformed into percentages for each week (each week sums up to 100%). Finally, we used a spatial interpolation procedure called 'kriging' to calculate the contours that are plotted in Fig.3.
This revealed that the median low temperature (3.7°C) occurred in week 7 (mid-February), while the median high temperature (24.0°C) occurred in week 34 (end of August). We found that over the past 7 years, temperatures at the end of January (week 5) were regularly as low as 0°C or as high 7°C; however, the warm colors in Fig.3 indicate that the most probable variability was much smaller variability (3-5°C). A total of 184 temperature measurements (0.2%) were actually negative, with the minimum of -1.7°C recorded on January 30th 2021 at 5:00 AM. Conversely, summer temperatures between 21-27°C were common, but the most probable range was 23-25°C. 300 measurements (0.3%) were higher than 27°C, with the maximum of 29.0°C recorded on August 14th 2016 at 5:30 PM.
Overall, this shallow New England Cove shows the typically large seasonality of nearshore habitats in North-American temperate latitudes (Baumann & Doherty 2013; Baumann et al. 2015). Sessile organisms (e.g. shellfish) are therefore highly temperature-tolerant, while the majority of fish species occur here only in spring, summer, and fall.
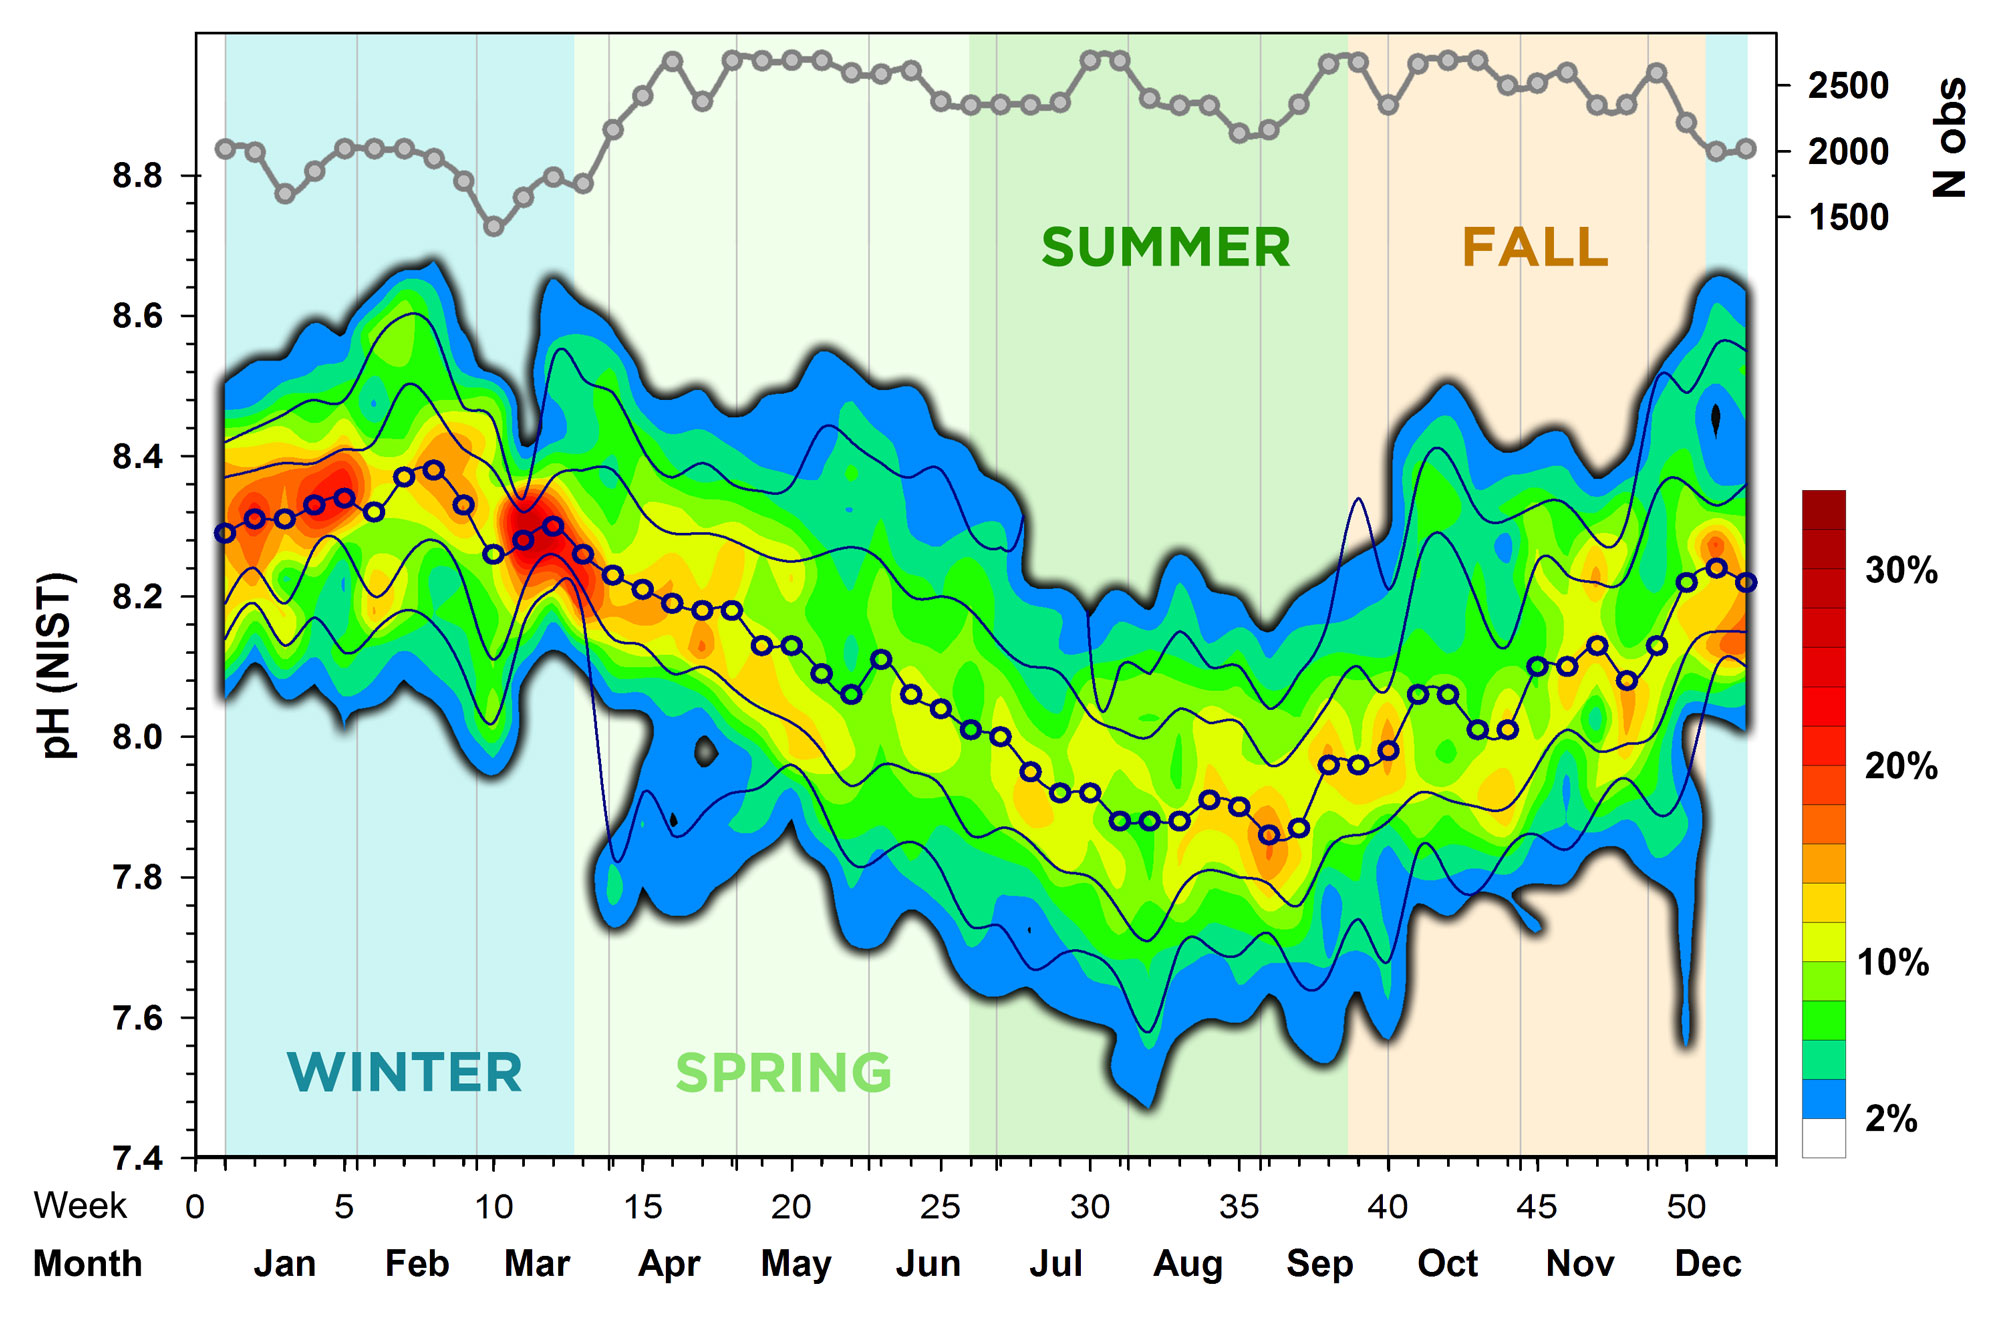
In a similar way, we looked at the overall seasonal pH conditions in Mumford Cove. Again, the pH-values were binned (pH 0.05 increments), counted within each bin and week of the year (across all years) and then expressed as percentages for each week (each week sums up to 100%). Kriging was again used to derive the spatial interpolation contours plotted in Fig.4.
We found that the median seasonal pH maximum (8.38) occurred in week 8 (end of February), while the median seasonal pH minimum (7.86) occurred in week 36 (early September). In other words, every year the system experiences a steady, 6 months decline in average pH conditions. The fact that the warmest colors are concentrated in the winter months means that weekly pH variability is lowest in winter, whereas pH conditions are more variable in summer. Summer pH lows of 7.6 were not uncommon; however, the most probable summer pH values ranged from 7.8 - 8.0. A total of 120 pH measurements (0.1%) were below pH 7.4, with the overall minimum of 7.13 recorded on July 19th 2021 at 9:00 AM. Conversely, pH highs during winter commonly exceeded 8.5, but the most probable range of pH values was 8.2 - 8.4. A total of 356 pH measurements (0.3%) were higher than 8.9, with the overall pH maximum of 9.10 recorded on July 23rd 2018 at 7:30 PM.
Overall, during the past 7 years, we find a clear pattern of a mid- to late summer pH depression, which is typical for productive nearshore habitats, where respiration and therefore metabolic CO2 production and acidification peak during summer (Wootton et al. 2008, Melzner et al. 2012, Gobler and Baumann 2016). However, compared to other embayments on Long Island Sound and other temperate salt marsh habitats, the seasonal pH depressions were less extreme and the metabolic acidification during summer rather subdued. On the other hand, the pH highs were considerably above open ocean conditions. This is likely a consequence of the extensive subaquatic vegetation in Mumford Cove, i.e., the eelgrass that can take up substantial amounts of CO2 during the photosynthetic time of the day and thereby increase the pH (Baumann et al. 2015).
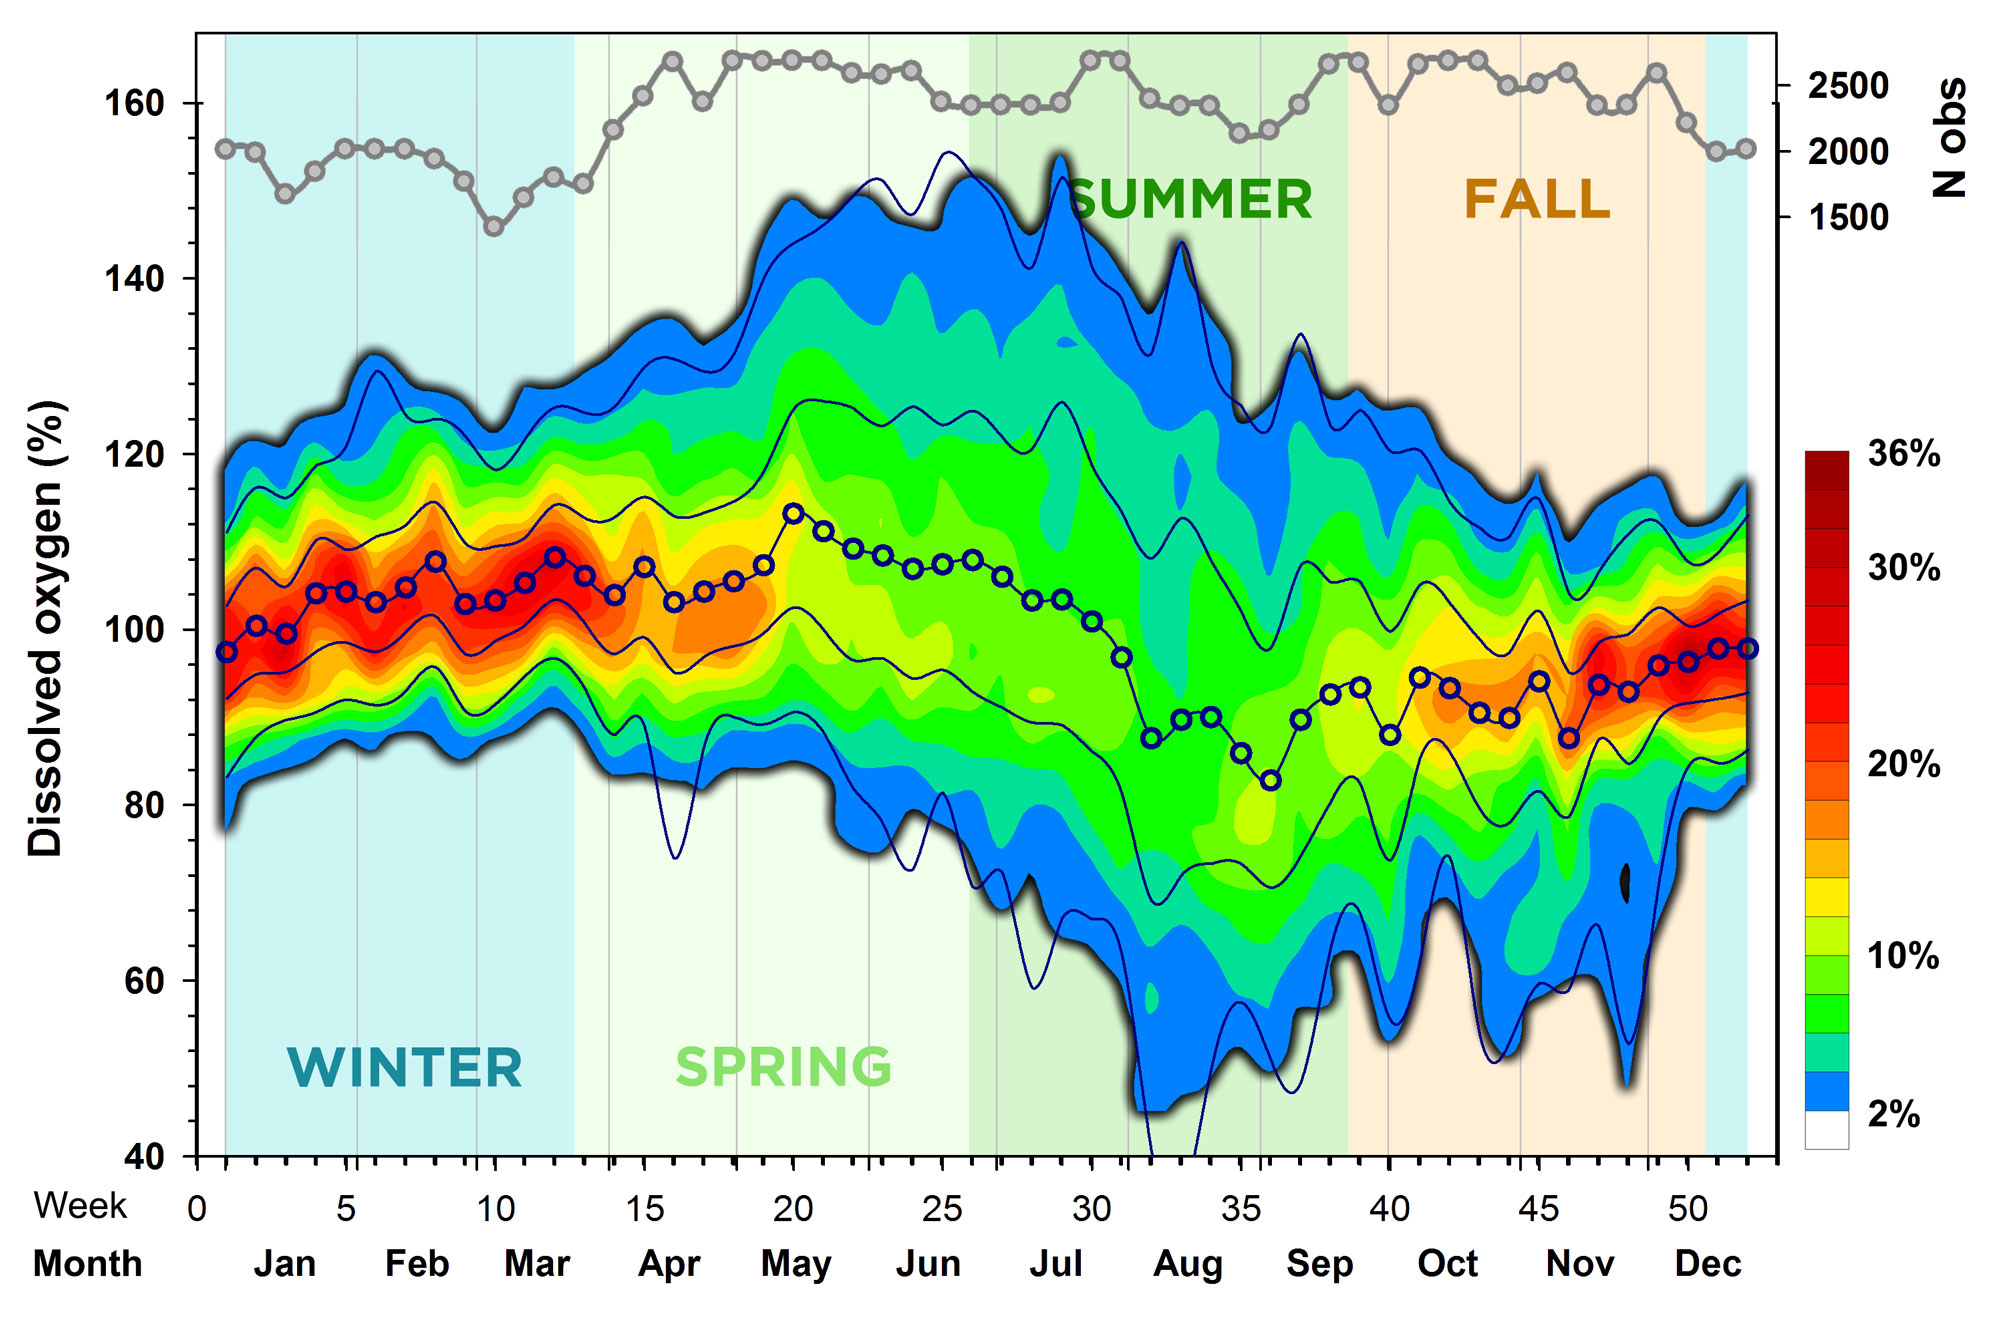
Now let's look at the overall seasonal pattern in dissolved oxygen (DO) conditions, which we express as percent saturation (%) to make measurements comparable across different temperature conditions (seasons) and because this is biologically more meaningful than absolute CO oxygen concentrations (in absolute terms, cold water holds more dissolved oxygen than warm water). Oxygen values were binned (5% increments), counted within each bin and week of the year (across all years) and then expressed as percentages for each week (each week sums up to 100%). Kriging was again used to derive the spatial interpolation contours plotted in Fig.5.
We found that the median seasonal DO maximum (113%) occurred in week 20 (mid-May), while the median seasonal DO minimum (83%) occurred in week 36 (early September), which is the same week that the seasonal pH minimum occurred (Fig.4). The warmest colors here indicate a strong concentration of values (~90 - 110%) around the median in fall, winter, and early spring. In late spring, summer, and early fall, on the other hand, the diel and weekly variability in DO was much greater, commonly exhibiting fluctuations between 80 - 120% saturation. It seems particularly noteworthy that extreme DO supersaturation of >140% was common in Mumford Cove during May, June and July. In fact, 205 measurements (0.2%) were higher than 170% saturation, with the maximum of 214% recorded on June 24th at 7:30 PM. Low oxygen conditions of <60% did occur in the Cove, predominantly in July and August, but they were not very frequent or particularly extreme. In total, we recorded only 234 measurements (0.2%) of <20% DO saturation.
Overall, we find an intriguing seasonal DO pattern in Mumford Cove that is related but not identical to the seasonal pH pattern, as it would be expected, if ecosystem metabolism would be the sole driver here. When the respiration of organisms from bacteria to plants and fish dominates - this is called net heterotrophy - oxygen is depleted and CO2 produced, the latter resulting in reduced pH. However, when the photosynthetic organisms consume CO2 while producing oxygen during the day, a water body could temporarily shift to net autotrophy, increasing oxygen and pH (Gobler and Baumann 2016). This was also generally true in Mumford, but on a seasonal basis the pH decline starts months before DO begins to decline as well. In addition, we saw only mild seasonal undersaturation but frequent, widespread, and often extreme oxygen supersaturation in Mumford Cove, which we suspect is due to its large subaquatic vegetation, specifically its eelgrass meadow. Simply put, the pH and oxygen patterns in Mumford Cove suggest that these plants ameliorate extreme short-term acidification and hypoxia that often characterizes other coastal system without such vegetation (Cloern et al. 2016, Breitburg et al. 2019).
Home | Introduction | Mumford Cove | Methods | Data - Seasonal - Diel/tidal - Interannual variability | References
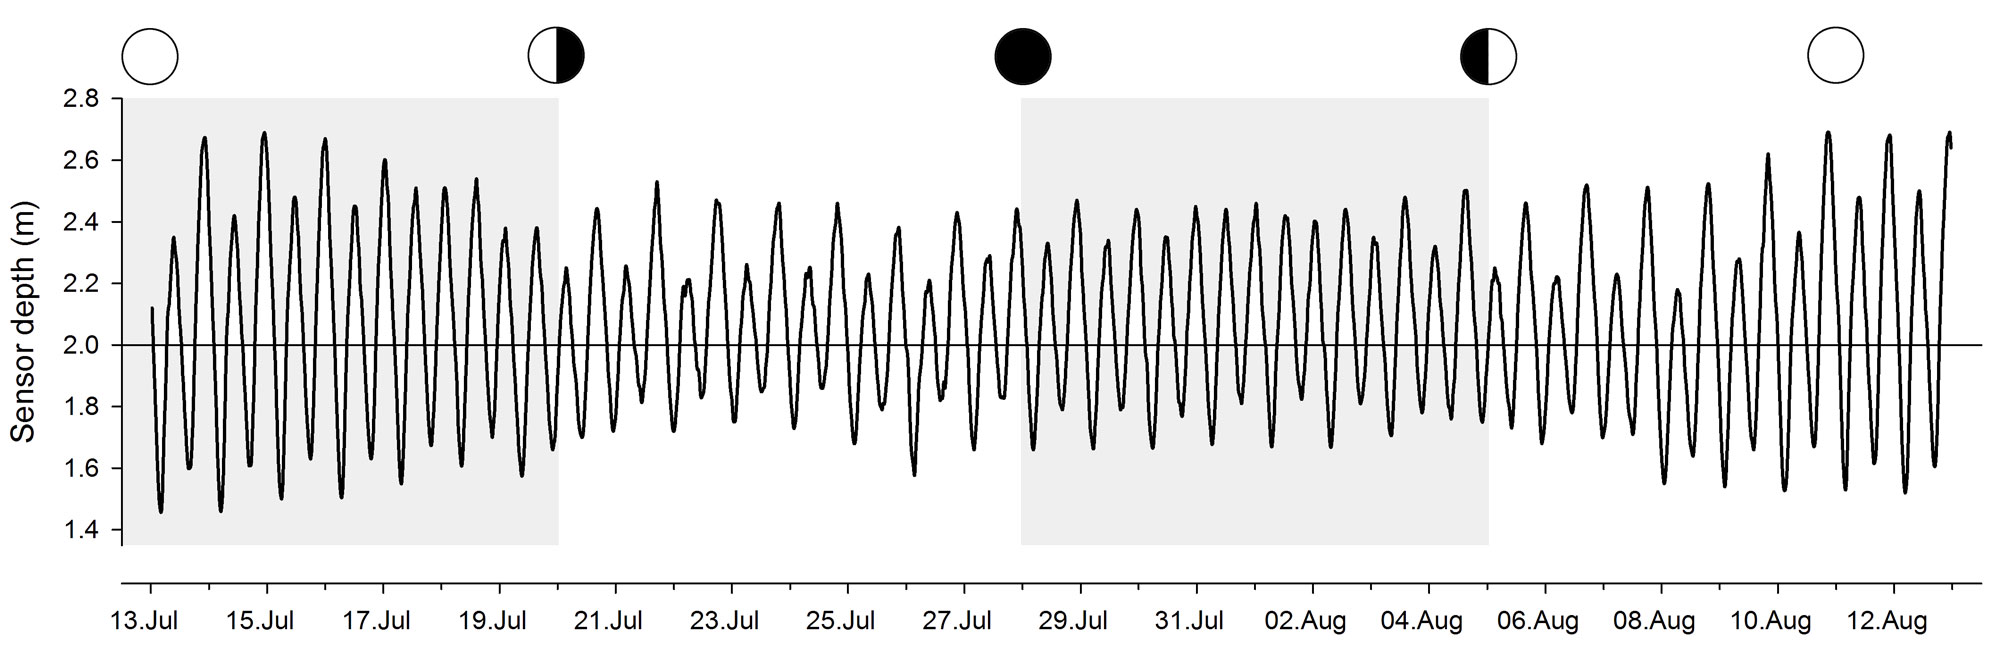
With the probe hanging suspended ~ 50 cm above the bottom of Mumford Cove, the depth sensor records the water level fluctuations above it. It provides a great glimpse of how dynamic a habitat the Cove really is. We see the clear 12h periodicity of the tides and that the first tide is always more extreme than the second one, although the difference between the two changes with the moon phases and prevailing wind conditions. The full moon tides are more extreme than the new moon tides. As shown in Fig.1, there's generally between 1-3m of water above the sensor; only in the most extreme events (think storm floods) values of 3-4m have been observed.
"In this dynamic environment, it is no wonder that temperature, pH, and dissolved oxygen conditions also show large fluctuations on diel and tidal cycles."
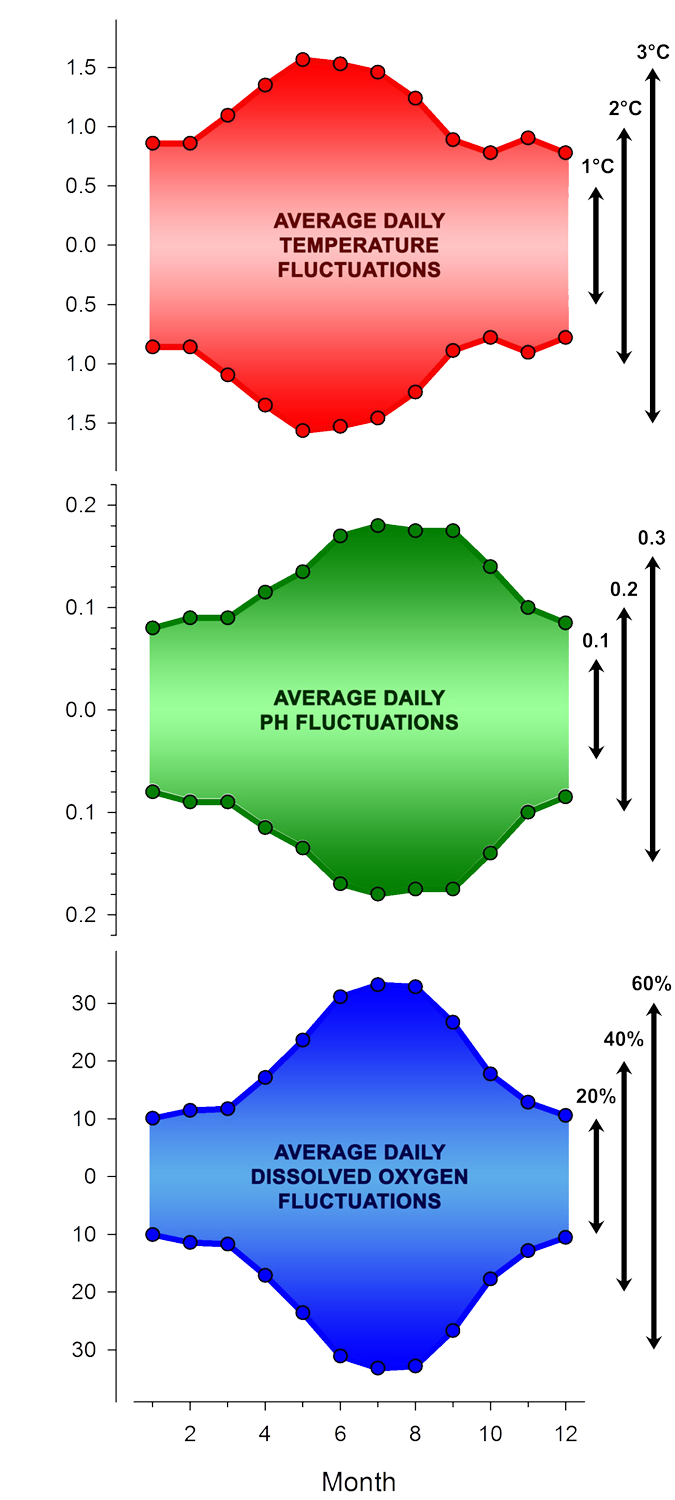
For a first general look, we located and then subtracted the minimum from the maximum value of each parameter for every day of the time series. Then we averaged all these values by month across all years, which is shown in Fig.7. We found average diel temperature ranges of <2°C between September - February, but larger diel temperature fluctuations up to 3°C between March and August. The largest diel temperature change on record occurred on May 17th 2015 (6.6°C), while the smallest diel temperature change occurred in 2018 on the day before Christmas (0.1°C, December 24th). Still, because of the high specific heat of water (it resists heating and cooling), diel temperature fluctuations are approximately one order of magnitude below the seasonal temperature change in Mumford Cove.
In contrast, diel pH and dissolved oxygen fluctuations swings were much larger, meaning that they were often of similar magnitude than the overall seasonal pattern. Between June - September, diel pH fluctuations averaged (!) ~0.36 pH units, and they still averaged ~0.18 pH units daily in winter and early spring (December - March) . The smallest and largest diel pH fluctuations occurred on December 20th 2020 (8.26 - 8.29, 0.03 pH units) and on September 20th 2018 (pH 7.42 - 9.01, 1.59 pH units!), respectively.
On average, dissolved oxygen conditions varied by more than 60% daily during summer months (June - August) and by ~20% daily during winter and early spring (December - March). The smallest and largest diel DO fluctuations occurred on December 17th 2020 (98 - 102%) and on June 12th 2017 (48 - 196%), respectively. Note that the average diel maxima are reached in May for temperature (likely because the day/night difference in air temperature is greatest then), but 2-3 months later for pH and DO (because that's when the biological productivity is greatest).
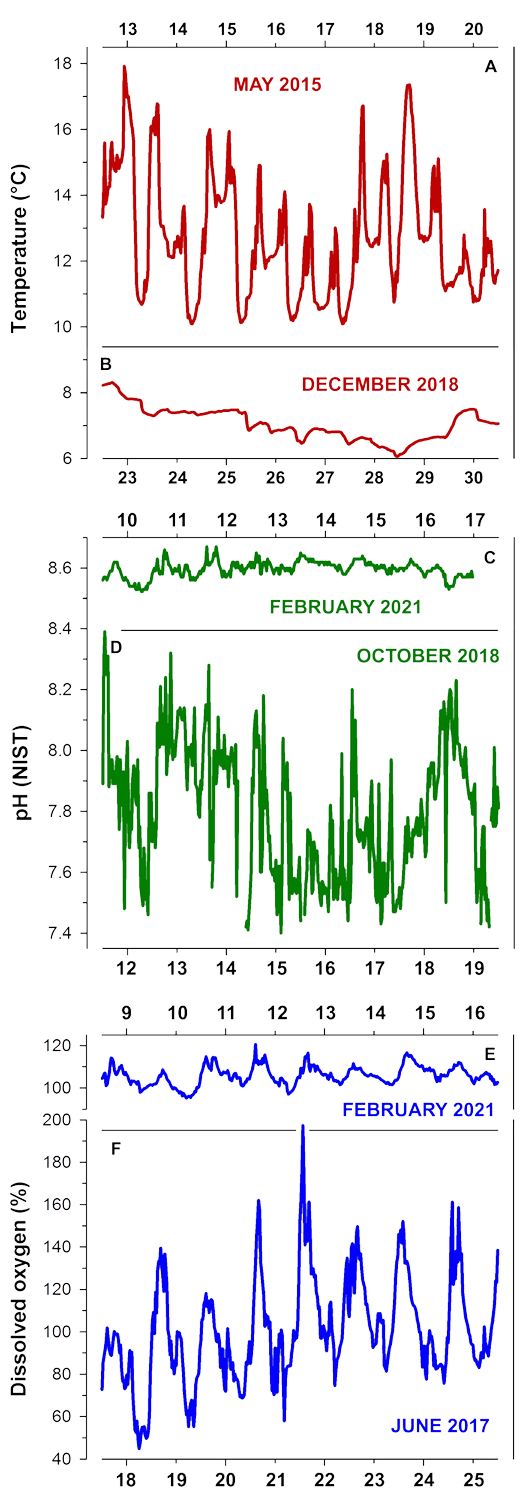
Here, in Fig.7 we show a few representative examples of diel and tidal temperature (A,B), pH (C,D), and DO fluctuations (E,F) over the course of 7 days.
When temperature fluctuations are large - as shown here for 13 - 20 May 2015, the tidal signal is very clear, because the shallow cove warms during low tide and then cools down again when the new high tide arrives.
In contrast, the day/night and tidal signal is less clear for the shown pH fluctuations between 12-19 October 2018.
However, the plotted diel DO fluctuations between 18 - 25 June 2017 show are clear day (high DO %) vs. night (low DO %) signal and perhaps a small tidal signal as well. In reality, DO conditions tend to reach their minimum at sunrise, while maxima are observed predominantly at the time of sunset.
Home | Introduction | Mumford Cove | Methods | Data - Seasonal - Diel/tidal - Interannual variability | References
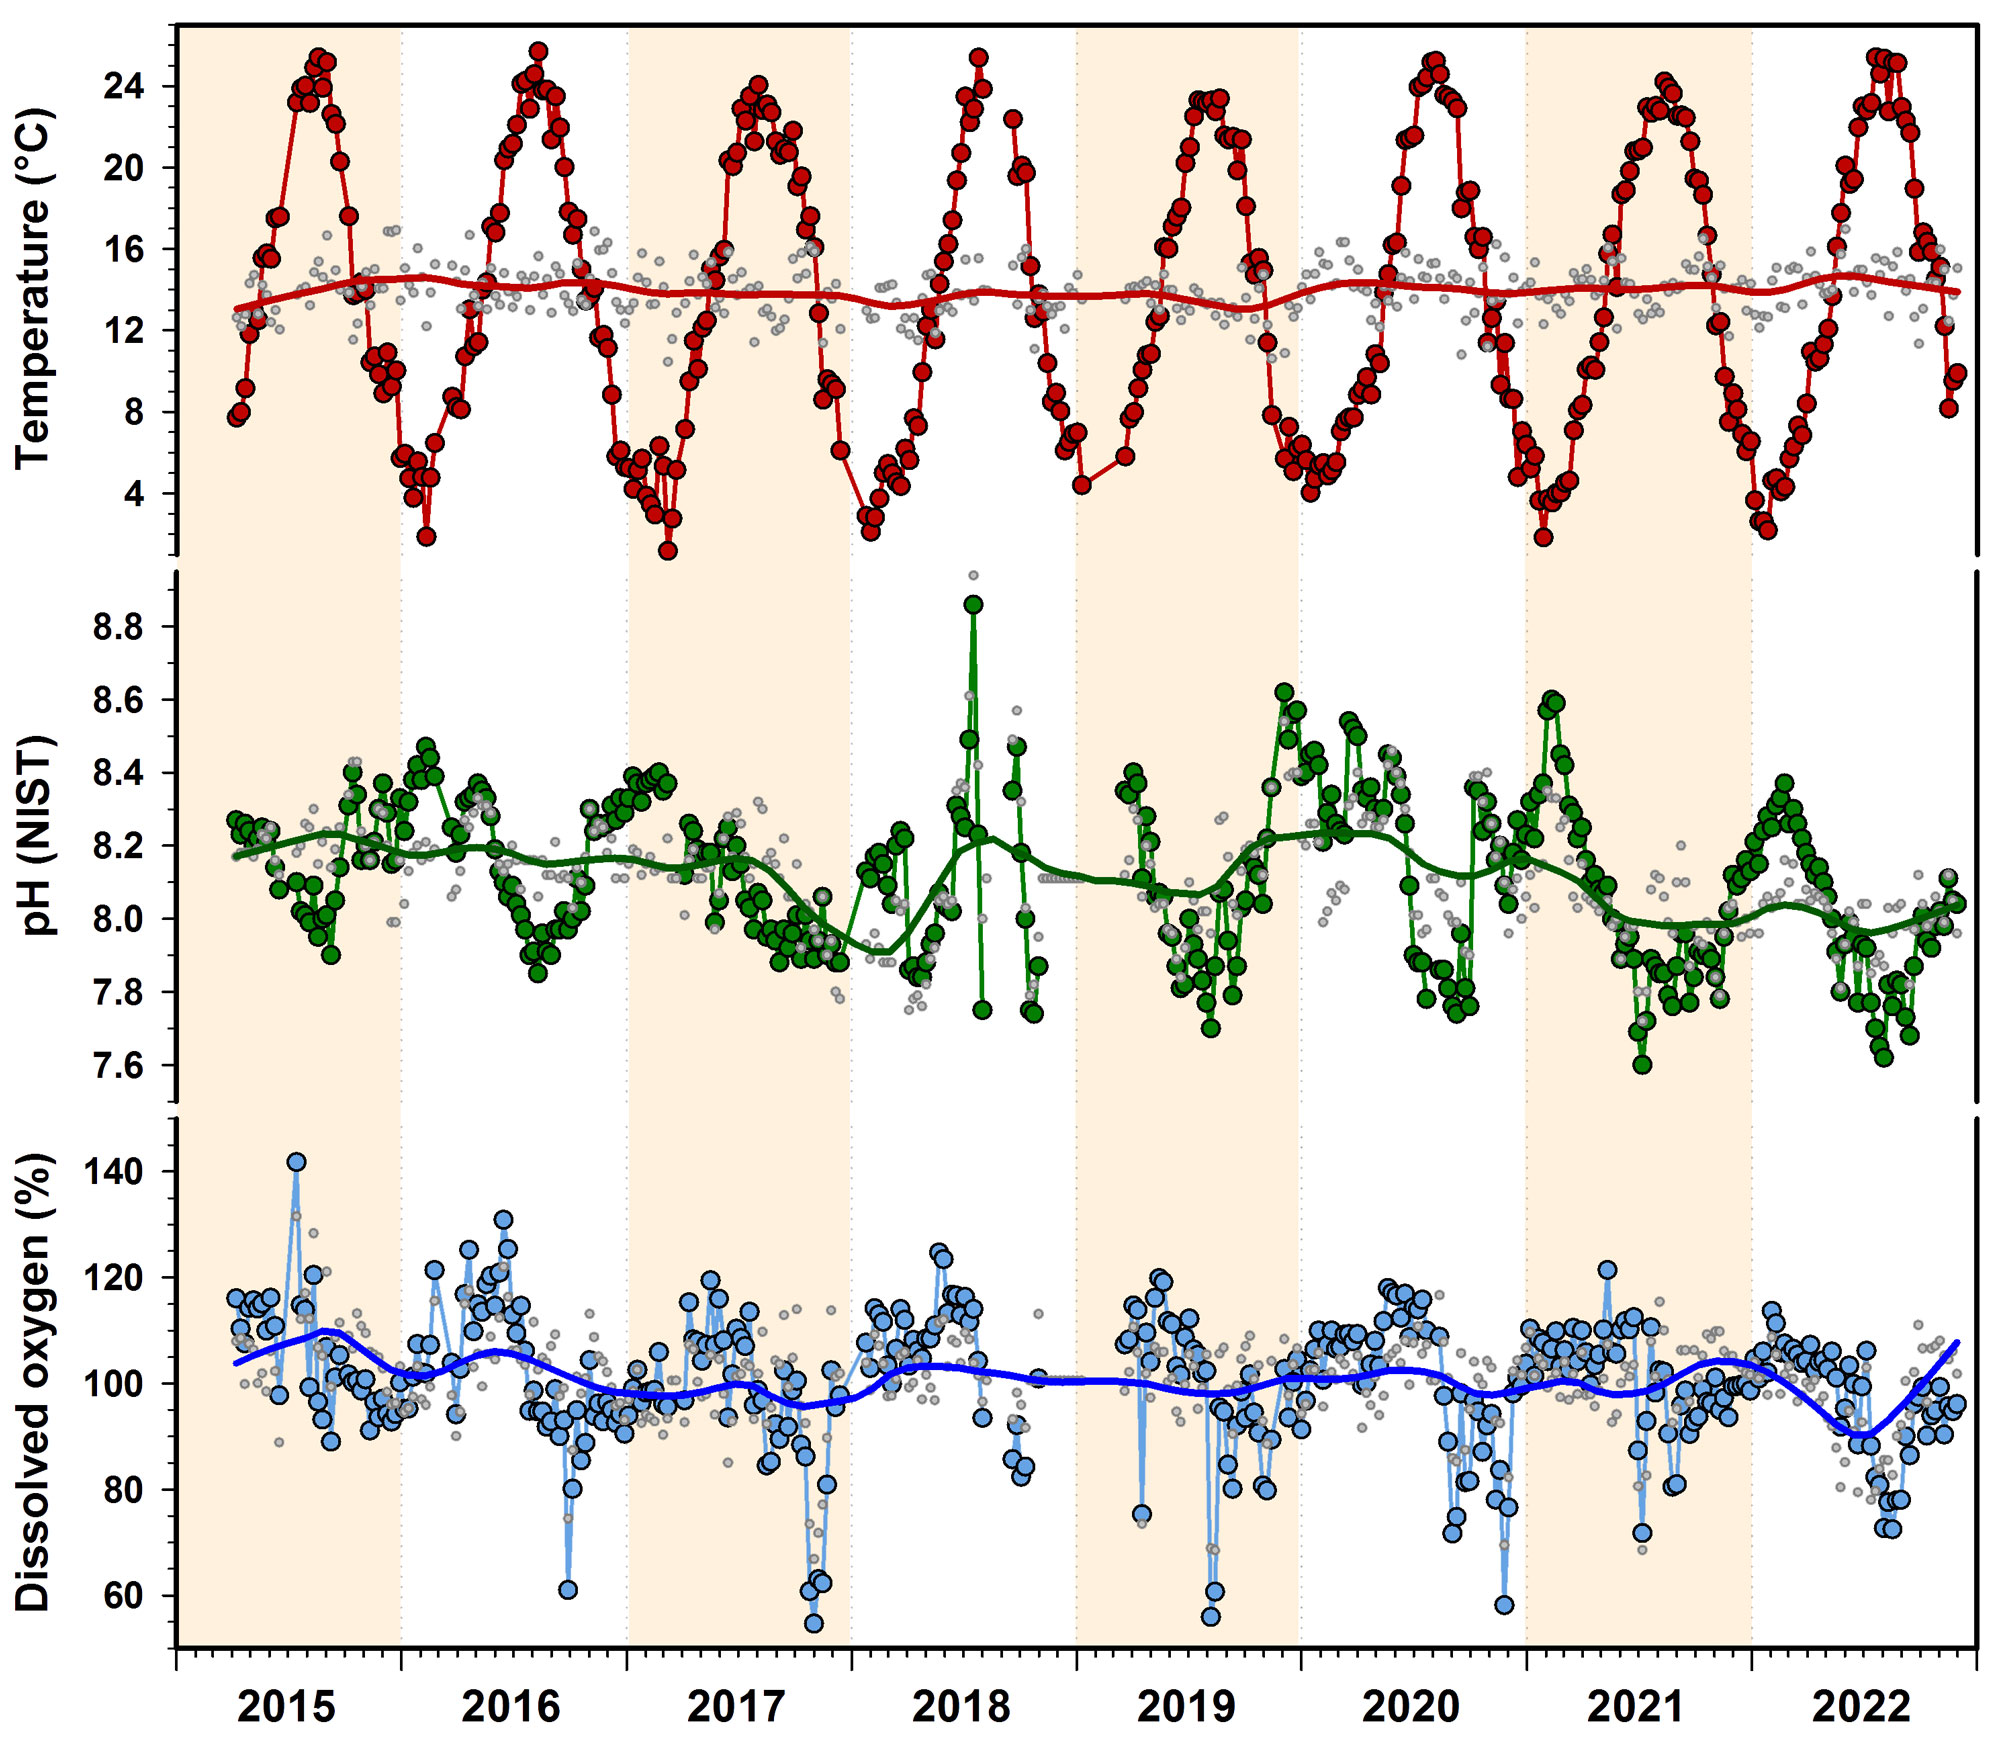
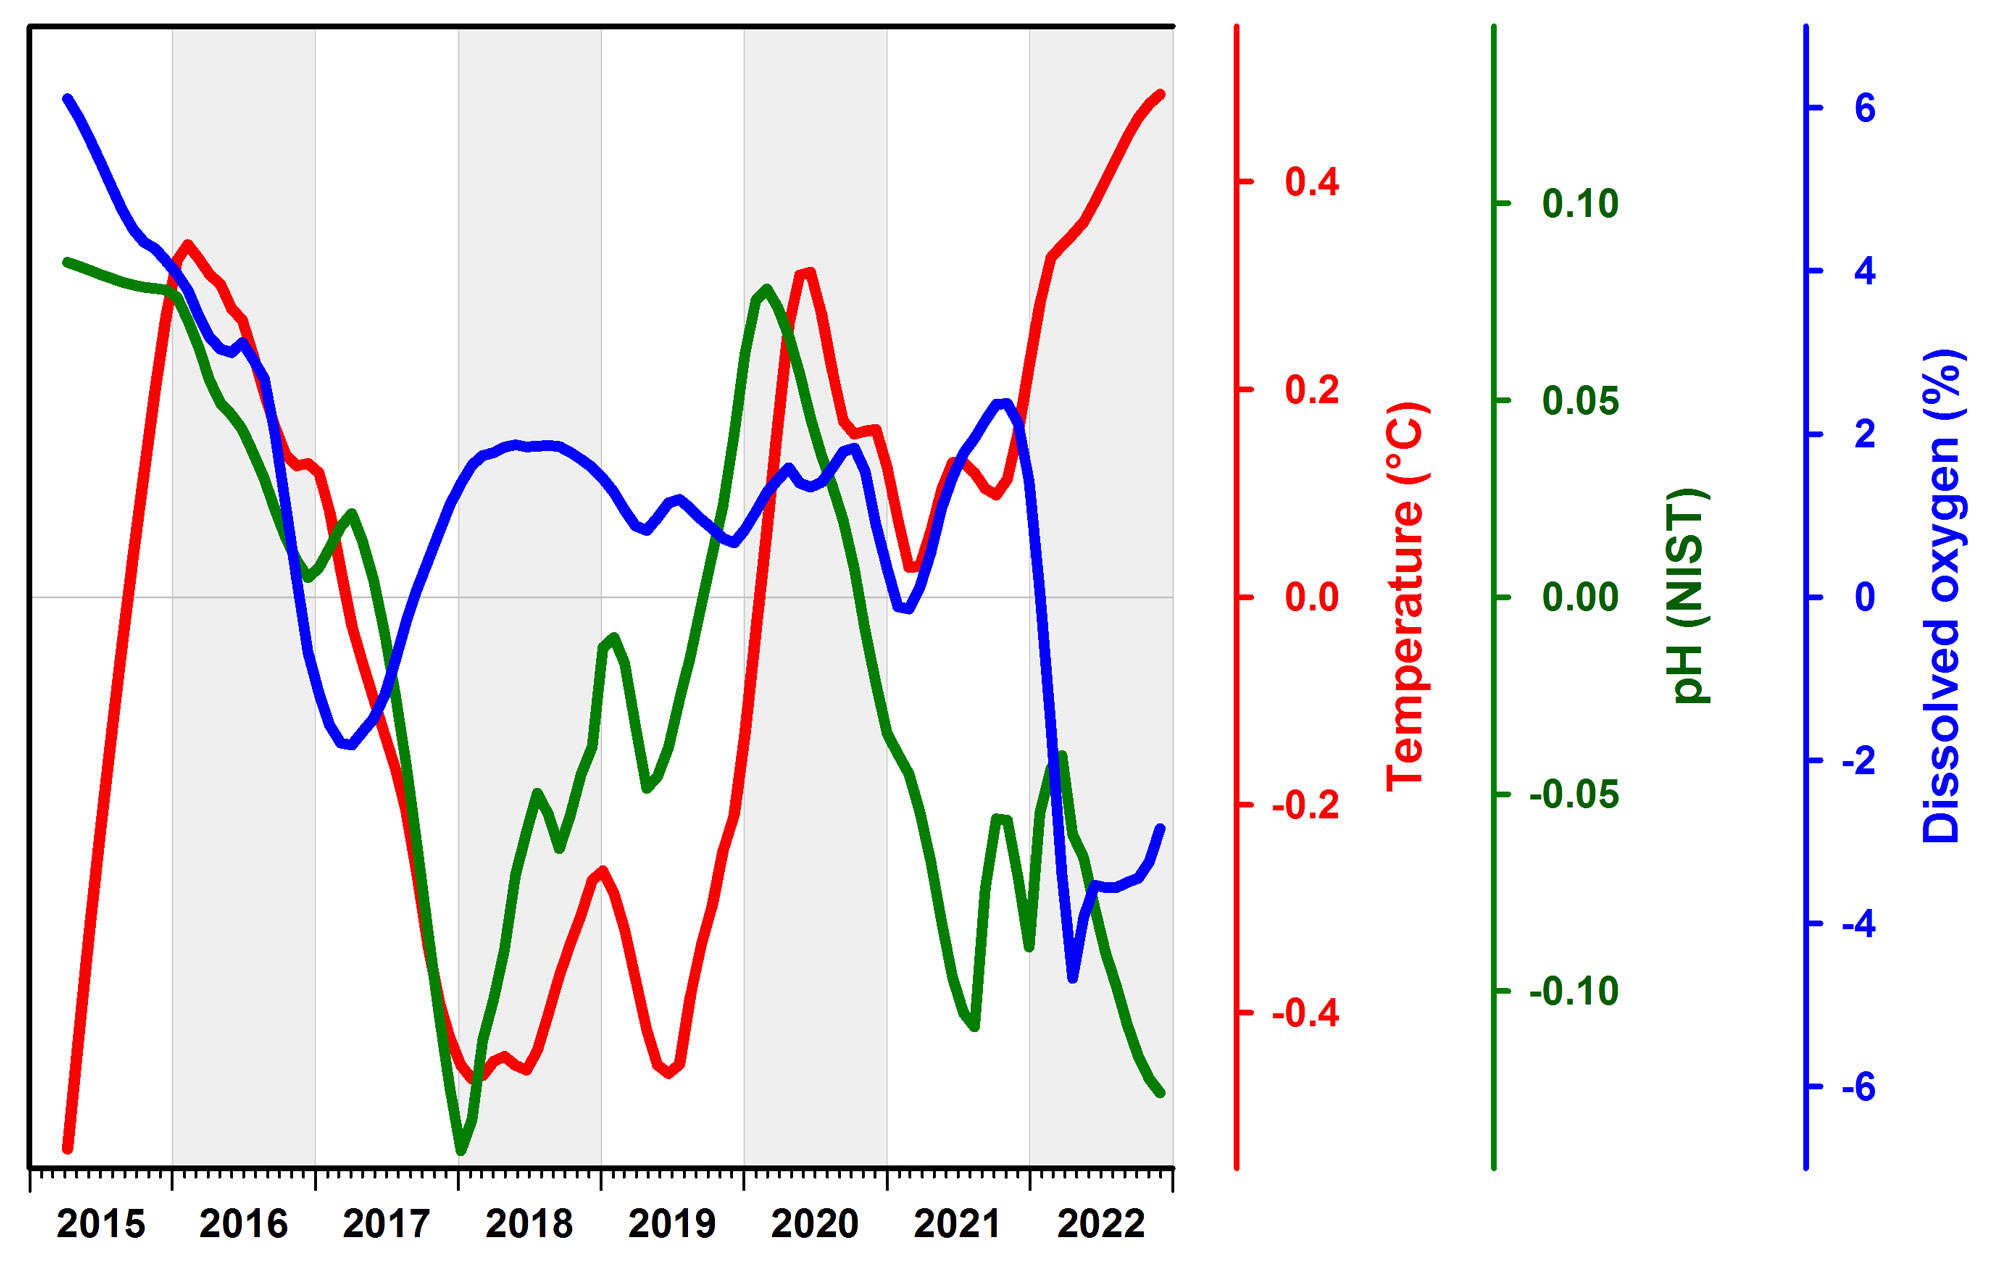
As the figure below illustrates, at the time of this analysis our time-series spanned 8 summers and 7 winters. This corresponds to approximately 70 individual boat trips to Mumford Cove, 560 AA or C8 batteries, and hundreds of hours of personnel time. And yet, while it is only natural to wonder whether the data would show "ocean warming" or "ocean acidification" - this is not a realistic expectation. Simply put, given the enormous background variability at tidal, diel, and seasonal scales that we have shown above - and of course the many associated uncertainties of the measurements themselves (accuracy, precision, calibration) - 7 years is not nearly enough time to detect meaningful interannual trends in our data.
Nonetheless, for each variable, we first calculated overall weekly means and then subtracted this value from the year-specific weekly mean to derive weekly anomalies (small grey circles in Fig.9). This essentially removed the overarching seasonal pattern. These anomalies were then fitted with local, non-parametric Loess smoothers that suggested periods of higher/lower seasonally detrended conditions (see also Fig.10), but these changes need to be interpreted with caution, as they are sensitive to missing data and other uncertainties.
These anomalies are also correlated with each other. For example, there's a significant negative correlation between temperature and pH (R = -0.64, P < 0.001) and between temperature and DO (R = -0.17, P = 0.001), which means that warmer temperatures are associated with relative acidification and oxygen loss. PH and DO anomalies were positively correlated (R = 0.38, P < 0.001), which is what we expect from the metabolic coupling of these two parameters (Baumann and Smith 2018).
When these anomalies were correlated to the time (week), we found no significant temperature change (P = 0.44), but statistically significant declines in pH (R = -0.32, P < 0.001) and DO over time (R = -0.20, P < 0.001). These trends are weak but consistent in direction with coastal acidification and oxygen loss that has been observed over longer time scales in eastern Long Island Sound and many other estuaries and coastal habitats (Snyder et al. 2019, Wallace et al. 2014).
Let's continue monitoring!
MatLab animation of high-frequency temperature (red, 20.7-28.3°C) measurements between 10 July - 31 August 2022 in Mumford Cove. Tick marks along the X-axis correspond to 5 days.
MatLab animation of high-frequency pH (green, 7.3-8.1 pH units) measurements between 10 July - 31 August 2022 in Mumford Cove. Tick marks along the X-axis correspond to 5 days.
MatLab animation of high-frequency dissolved oxygen (blue, 13-152%) measurements between 10 July - 31 August 2022 in Mumford Cove. Tick marks along the X-axis correspond to 5 days.
Home | Introduction | Mumford Cove | Methods | Data - Seasonal - Diel/tidal - Interannual variability | References