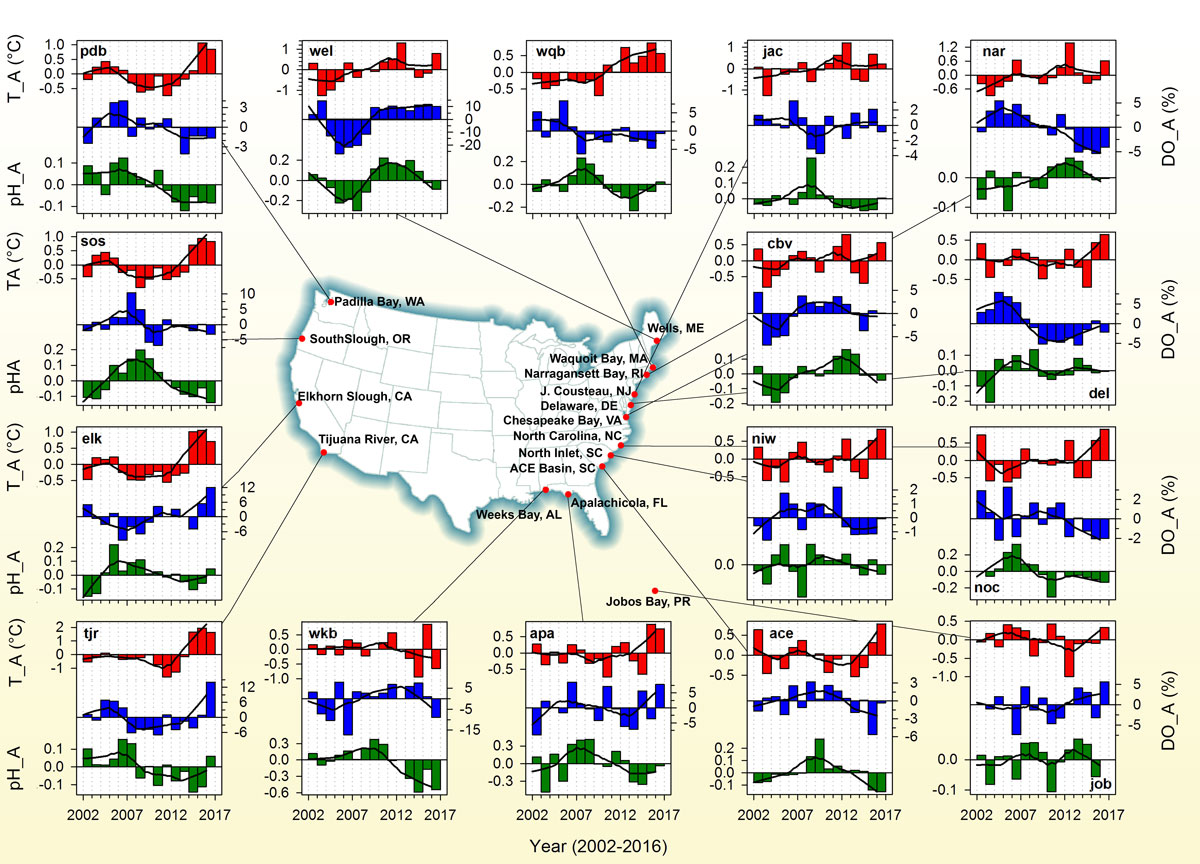
October, 2nd, 2017: Happy to announce that Estuaries and Coasts just published (online) our article that looked at unifying principles of pH and DO fluctuations across many US nearshore habitats. The datasets belongs to the US Nearshore Estuaries Research Reserves System (NERRS) and is one of the most extensive monitoring datasets in coastal aquatic habitats. In this case, we used 15 years of continuous monitoring data (> 5 million data points) from 16 different reserves across the US Atlantic, Caribbean, Gulf of Mexico, and Pacific coasts and analyzed short- to long-term variability in pH and DO fluctuations. Among the highlights:
- Our analyses confirmed that large, metabolically driven fluctuations of pH and DO are a unifying feature of nearshore habitats. Even more so, we were able to show that across habitats, one can predict mean pH or mean diel pH fluctuations simply based on salinity and oxygen levels/fluctuations. This provided strong empirical evidence that common metabolic principles drive diel to seasonal pH/DO variations within as well as across a diversity of estuarine environments.
- As expected, there were no interannual, monotonic trends in nearshore pH conditions; instead interannual fluctuations were of similar magnitude than the pH decrease predicted for the average surface ocean over the next three centuries.
- By correlating weekly anomalies of pH, oxygen, and temperature, we found strong empirical support for the notion that coastal acidification — in addition to being driven by eutrophication and atmospheric CO2 increases — is exacerbated simply by warming, likely via increasing community respiration.
Citation and link:
Baumann, H. and Smith, E. (2017) Quantifying metabolically-driven pH and oxygen fluctuations in US nearshore habitats at diel to interannual time-scales Estuaries & Coasts (published online 2 Oct 2017)