Month: October 2017

[Lab news] Baumann lab participates in Avery Point Open House Event

Large-50th-Logo-white-background-3-e1484861299421
15 October 2017: All members of the Baumann lab – Hannes, Emma, Chris, Julie and Jake had fun at an Open House event at the Avery Point Campus as part of the 50th Anniversary celebrations. The whole department participated with a flurry of educational activities and fun exhibitions.
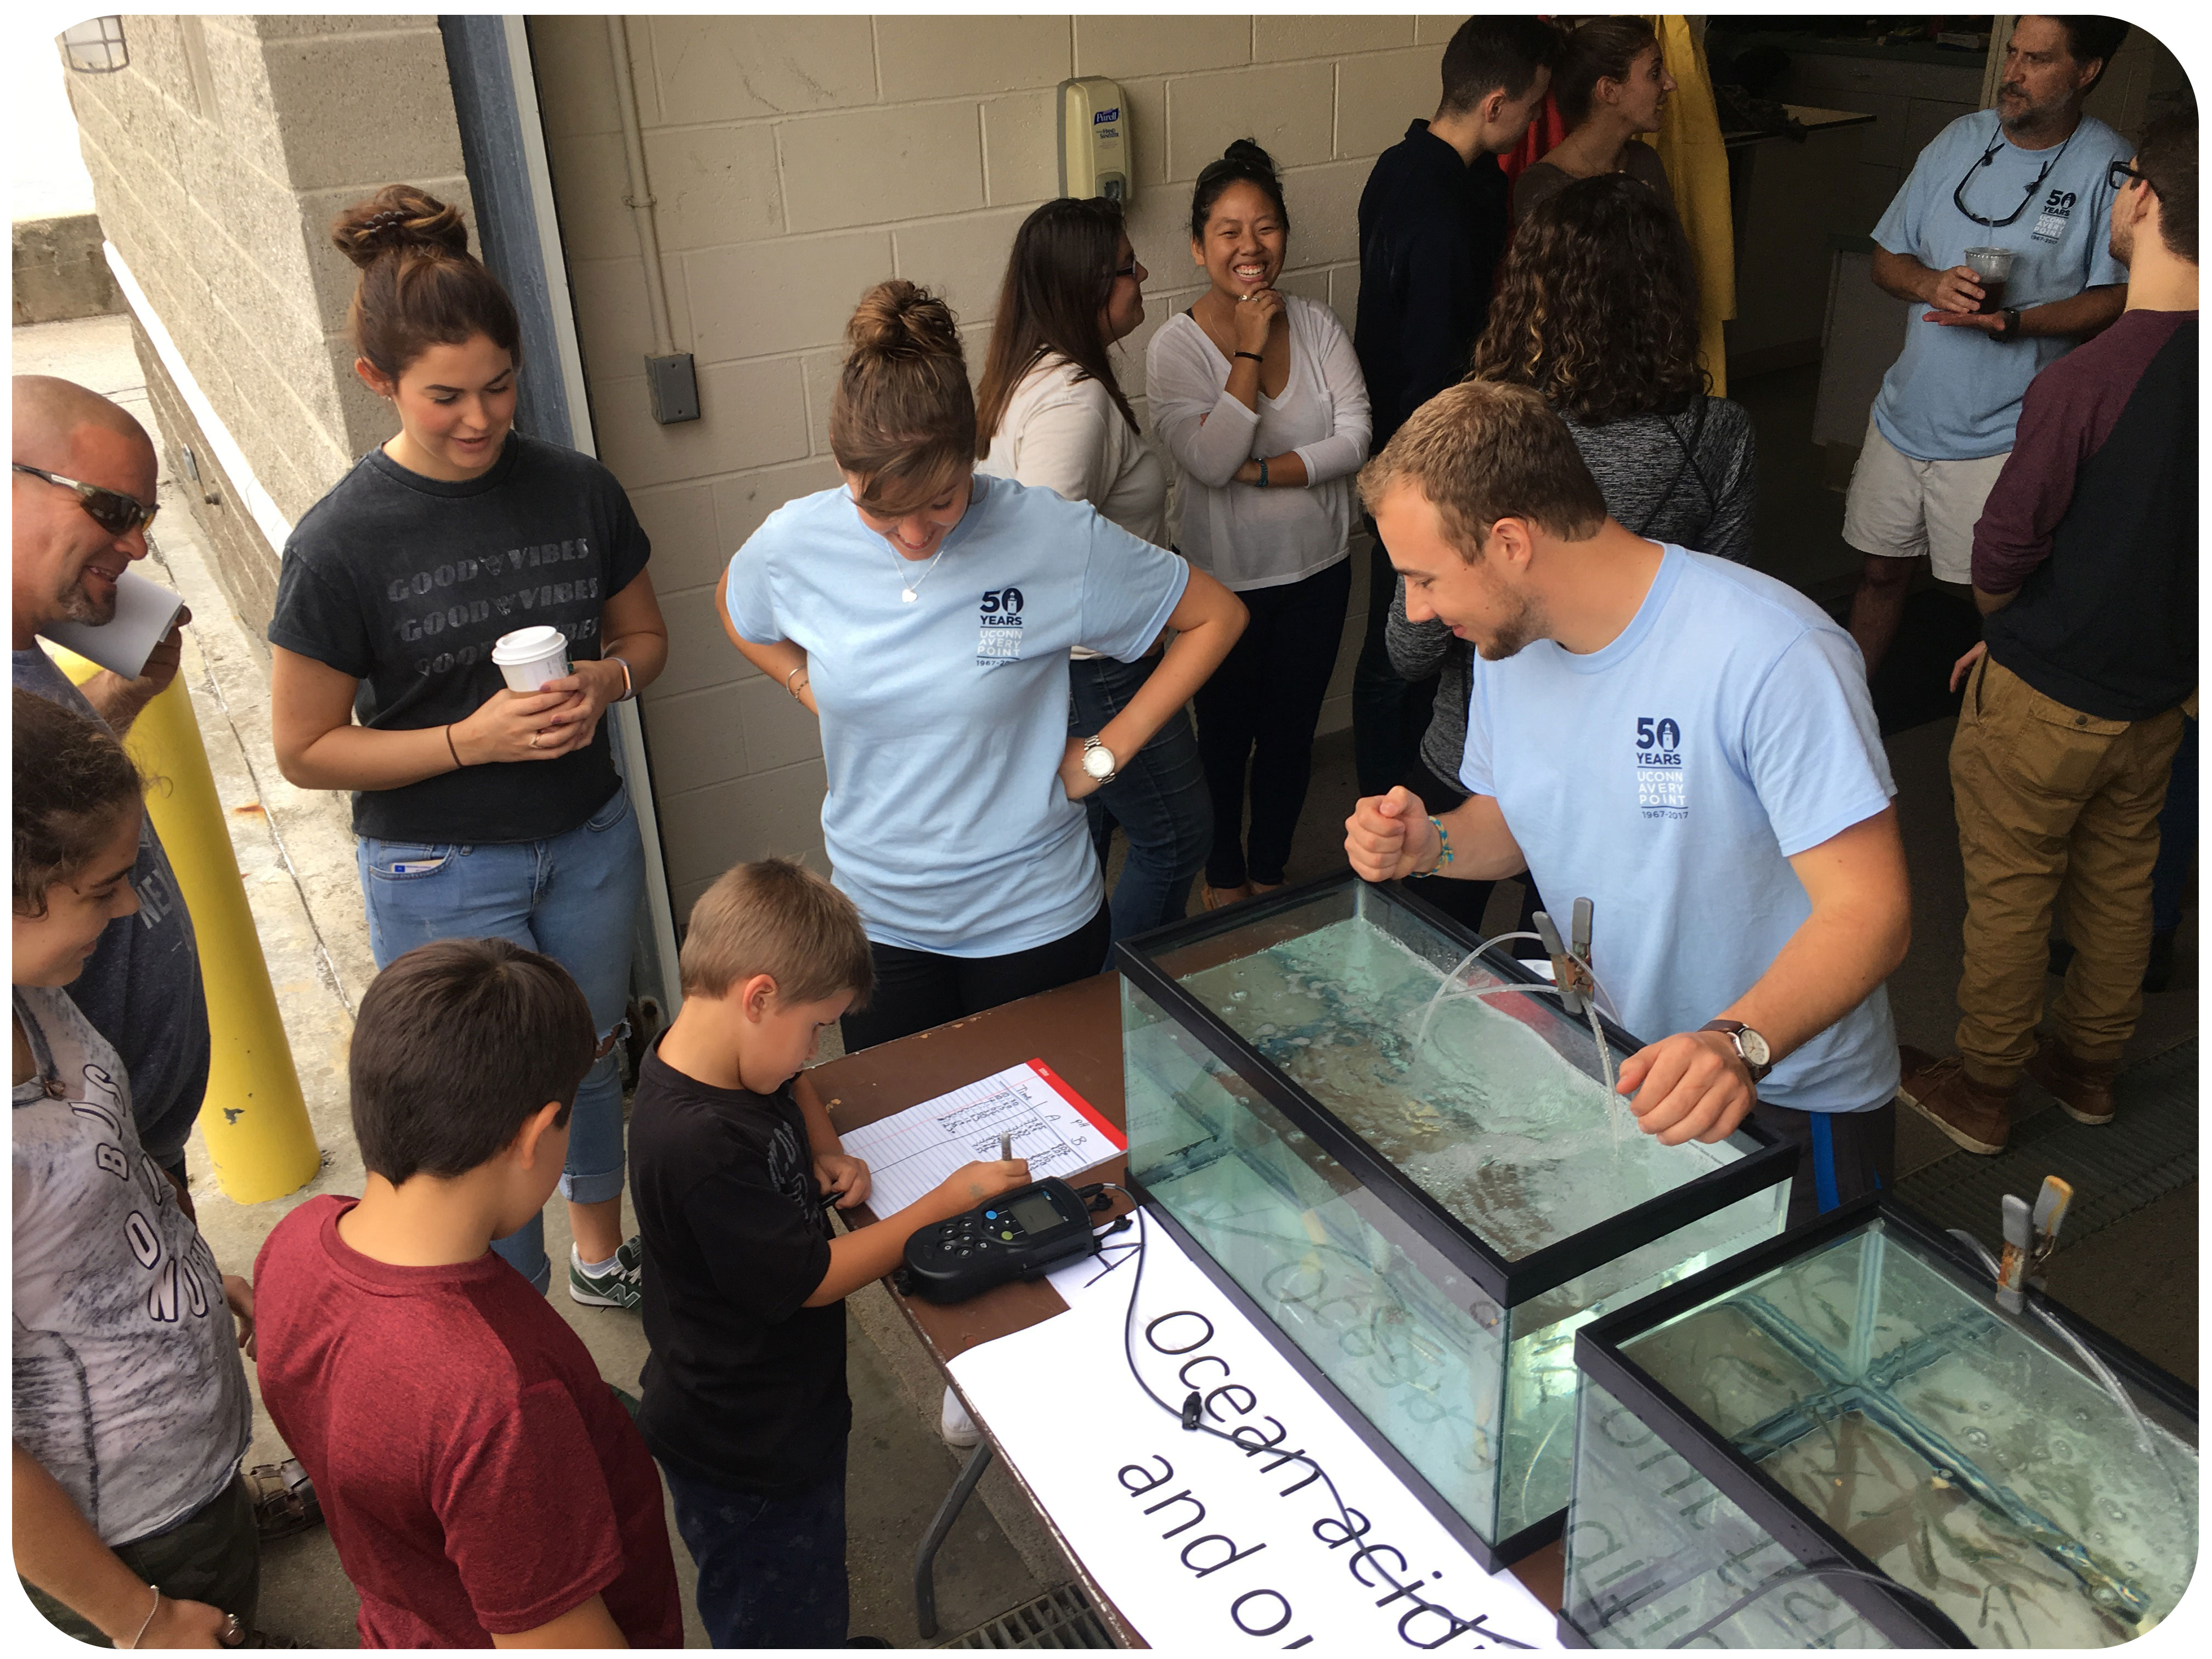
Our lab manned a table outside the Rankin Lab, telling people about the nearshore fish community, the phenomenon of ocean acidification and the measurement of pH in water. Everybody chipped in, thanks!
Hannes also premiered reciting Dr. Seuss’ “The Lorax” in front of young and old in the AP auditorium.

Check out some of the fun around the “Ocean Acidification and our fish” table:

ChrisTank
There are fish!
JakeandJulieTable
Jake and Emma assist a little scientist in measuring the pH in our two demonstration tanks


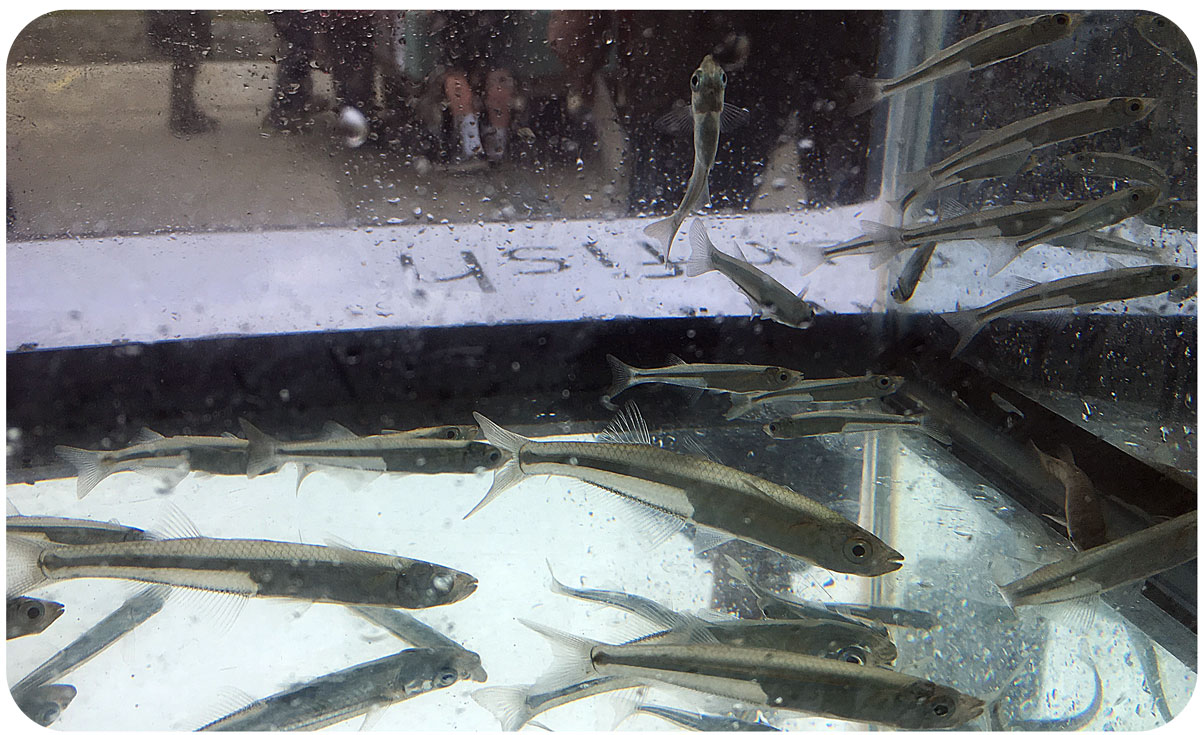
Menidia
Atlantic silversides from Mumford Cove, CT, swimming in our tanks. After the end of the demonstration, we released back into the wild.
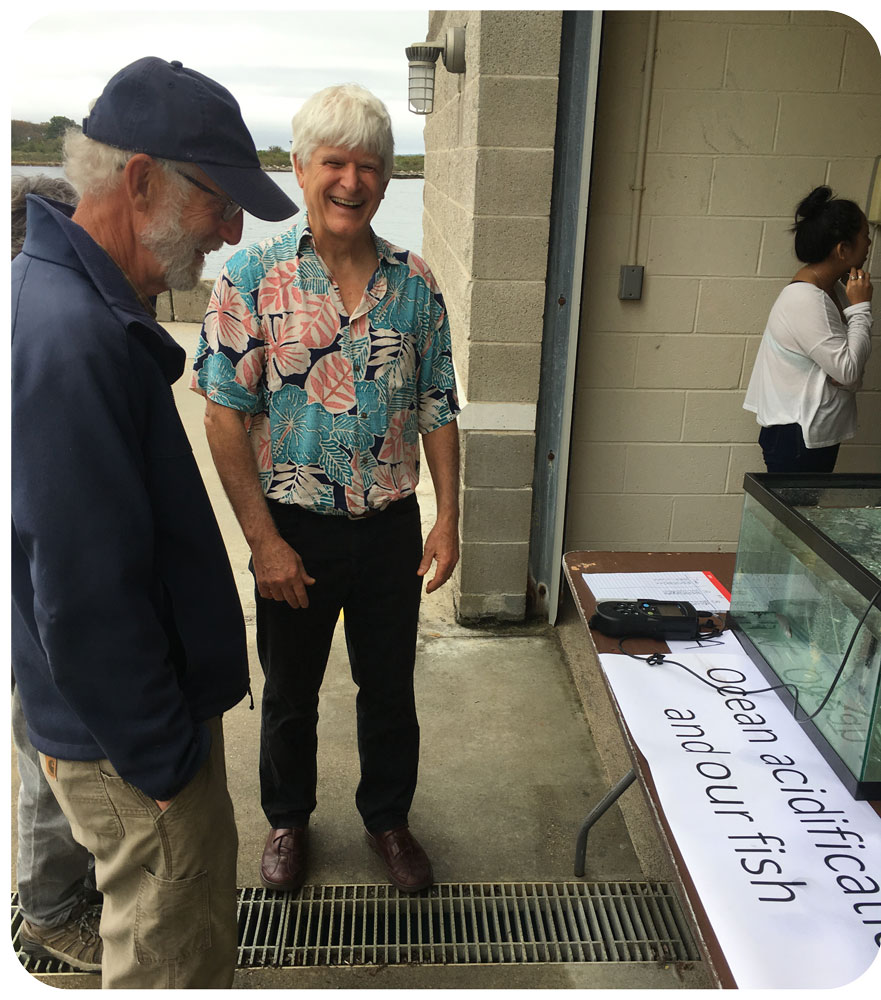
RobMason
Prof. Rob Mason taking briefly over our display. Emerging topic apparently – Mercury and ocean acidification


SashaLuka
Fascinating sea life …

Lukaseastar
What an incredible creature a sea star is!

DrSeuss
Hannes recited “The Lorax” – Dr. Seuss classic, comic-poetic tale of greed and environmental destruction

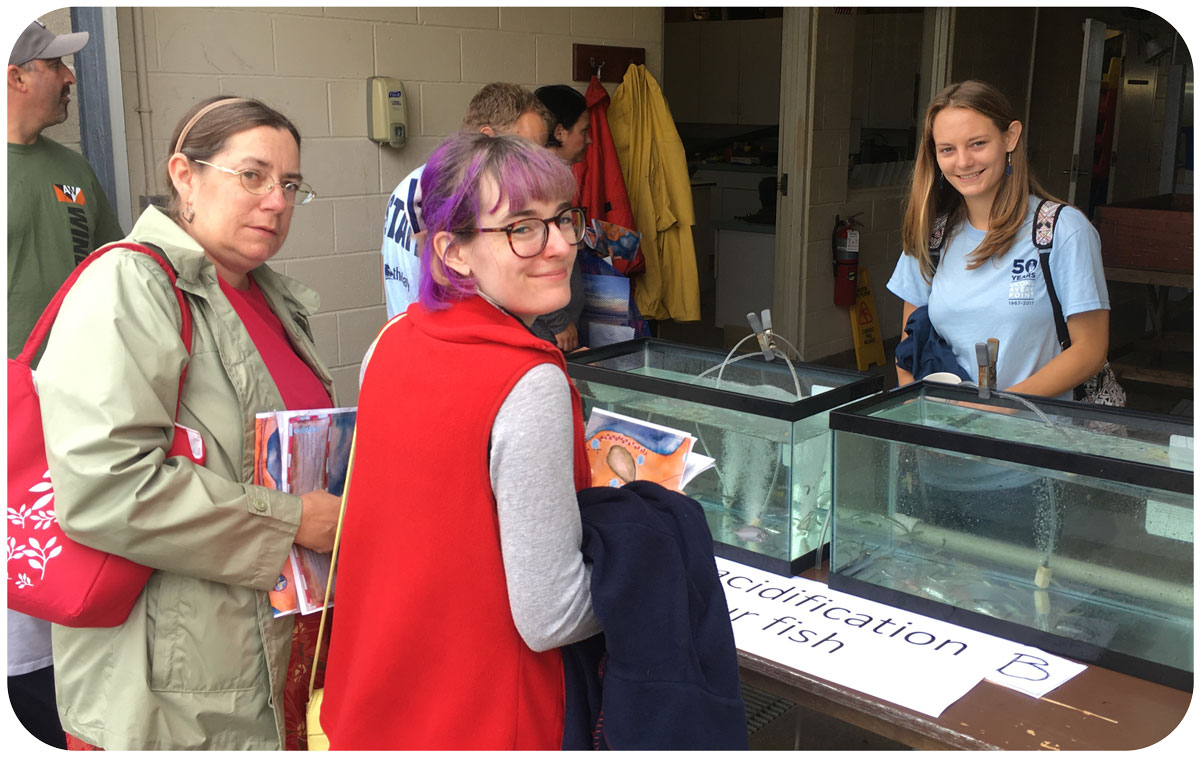
JulieTableLizSister
Julie manning our Ocean acidification outreach table at the Rankin Lab on 15 Oct 2017

[Lab news] Measuring juvenile silversides. Live.

10 October 2017. Today, Chris, Emma, and Julie measured over 400 juvenile Atlantic silversides for their length and weight. This time, however, we did not euthanize the fish before, but successfully measured them while still alive, only a little drowsy from the mild anesthetic we administered before.

Click on the video below to have a look for yourself.
Congratulations all, for a job well done!


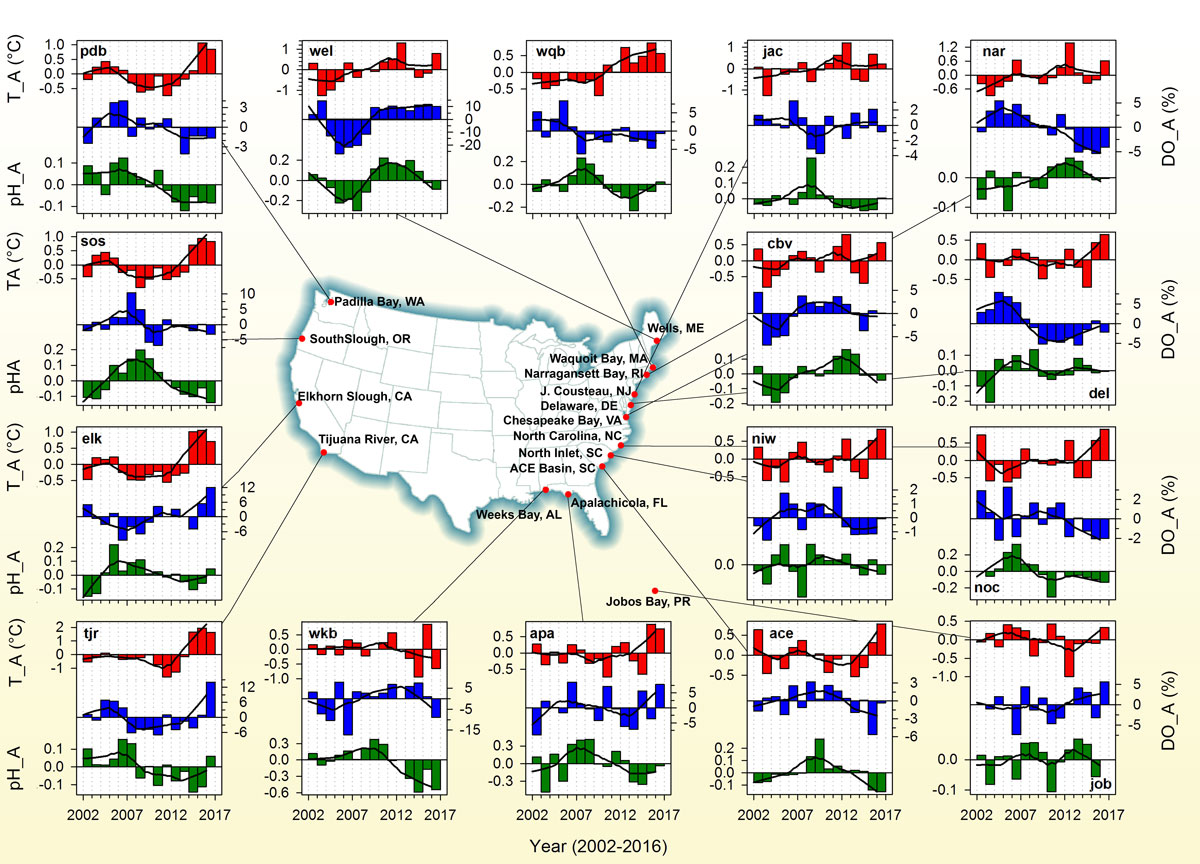
[New publication] Nearshore pH and DO fluctuations across 16 US estuaries!

October, 2nd, 2017: Happy to announce that Estuaries and Coasts just published (online) our article that looked at unifying principles of pH and DO fluctuations across many US nearshore habitats. The datasets belongs to the US Nearshore Estuaries Research Reserves System (NERRS) and is one of the most extensive monitoring datasets in coastal aquatic habitats. In this case, we used 15 years of continuous monitoring data (> 5 million data points) from 16 different reserves across the US Atlantic, Caribbean, Gulf of Mexico, and Pacific coasts and analyzed short- to long-term variability in pH and DO fluctuations. Among the highlights:

  • Our analyses confirmed that large, metabolically driven fluctuations of pH and DO are a unifying feature of nearshore habitats. Even more so, we were able to show that across habitats, one can predict mean pH or mean diel pH fluctuations simply based on salinity and oxygen levels/fluctuations. This provided strong empirical evidence that common metabolic principles drive diel to seasonal pH/DO variations within as well as across a diversity of estuarine environments.
  • As expected, there were no interannual, monotonic trends in nearshore pH conditions; instead interannual fluctuations were of similar magnitude than the pH decrease predicted for the average surface ocean over the next three centuries.
  • By correlating weekly anomalies of pH, oxygen, and temperature, we found strong empirical support for the notion that coastal acidification — in addition to being driven by eutrophication and atmospheric CO2 increases — is exacerbated simply by warming, likely via increasing community respiration.

Citation and link:
Baumann, H. and Smith, E. (2017) Quantifying metabolically-driven pH and oxygen fluctuations in US nearshore habitats at diel to interannual time-scales Estuaries & Coasts (published online 2 Oct 2017)


Baumann-&-Smith-ESCO_Fig6
Among many other aspects, the paper analyzed interannual trends in temperature (red bars), dissolved oxygen (%, blue bars), and pH (green bars) at 16 US Nearshore Ecological Research Reserves (NERRS), shown as yearly anomalies derived from averaging monthly anomalies for each variable, site, and year. Black trend lines were derived by LOESS smoothing.