Web cookies (also called HTTP cookies, browser cookies, or simply cookies) are small pieces of data that websites store on your device (computer, phone, etc.) through your web browser. They are used to remember information about you and your interactions with the site.
Purpose of Cookies:
Session Management:
Keeping you logged in
Remembering items in a shopping cart
Saving language or theme preferences
Personalization:
Tailoring content or ads based on your previous activity
Tracking & Analytics:
Monitoring browsing behavior for analytics or marketing purposes
Types of Cookies:
Session Cookies:
Temporary; deleted when you close your browser
Used for things like keeping you logged in during a single session
Persistent Cookies:
Stored on your device until they expire or are manually deleted
Used for remembering login credentials, settings, etc.
First-Party Cookies:
Set by the website you're visiting directly
Third-Party Cookies:
Set by other domains (usually advertisers) embedded in the website
Commonly used for tracking across multiple sites
Authentication cookies are a special type of web cookie used to identify and verify a user after they log in to a website or web application.
What They Do:
Once you log in to a site, the server creates an authentication cookie and sends it to your browser. This cookie:
Proves to the website that you're logged in
Prevents you from having to log in again on every page you visit
Can persist across sessions if you select "Remember me"
What's Inside an Authentication Cookie?
Typically, it contains:
A unique session ID (not your actual password)
Optional metadata (e.g., expiration time, security flags)
Analytics cookies are cookies used to collect data about how visitors interact with a website. Their primary purpose is to help website owners understand and improve user experience by analyzing things like:
How users navigate the site
Which pages are most/least visited
How long users stay on each page
What device, browser, or location the user is from
What They Track:
Some examples of data analytics cookies may collect:
Page views and time spent on pages
Click paths (how users move from page to page)
Bounce rate (users who leave without interacting)
User demographics (location, language, device)
Referring websites (how users arrived at the site)
Here’s how you can disable cookies in common browsers:
1. Google Chrome
Open Chrome and click the three vertical dots in the top-right corner.
Go to Settings > Privacy and security > Cookies and other site data.
Choose your preferred option:
Block all cookies (not recommended, can break most websites).
Block third-party cookies (can block ads and tracking cookies).
2. Mozilla Firefox
Open Firefox and click the three horizontal lines in the top-right corner.
Go to Settings > Privacy & Security.
Under the Enhanced Tracking Protection section, choose Strict to block most cookies or Custom to manually choose which cookies to block.
3. Safari
Open Safari and click Safari in the top-left corner of the screen.
Go to Preferences > Privacy.
Check Block all cookies to stop all cookies, or select options to block third-party cookies.
4. Microsoft Edge
Open Edge and click the three horizontal dots in the top-right corner.
Go to Settings > Privacy, search, and services > Cookies and site permissions.
Select your cookie settings from there, including blocking all cookies or blocking third-party cookies.
5. On Mobile (iOS/Android)
For Safari on iOS: Go to Settings > Safari > Privacy & Security > Block All Cookies.
For Chrome on Android: Open the app, tap the three dots, go to Settings > Privacy and security > Cookies.
Be Aware:
Disabling cookies can make your online experience more difficult. Some websites may not load properly, or you may be logged out frequently. Also, certain features may not work as expected.
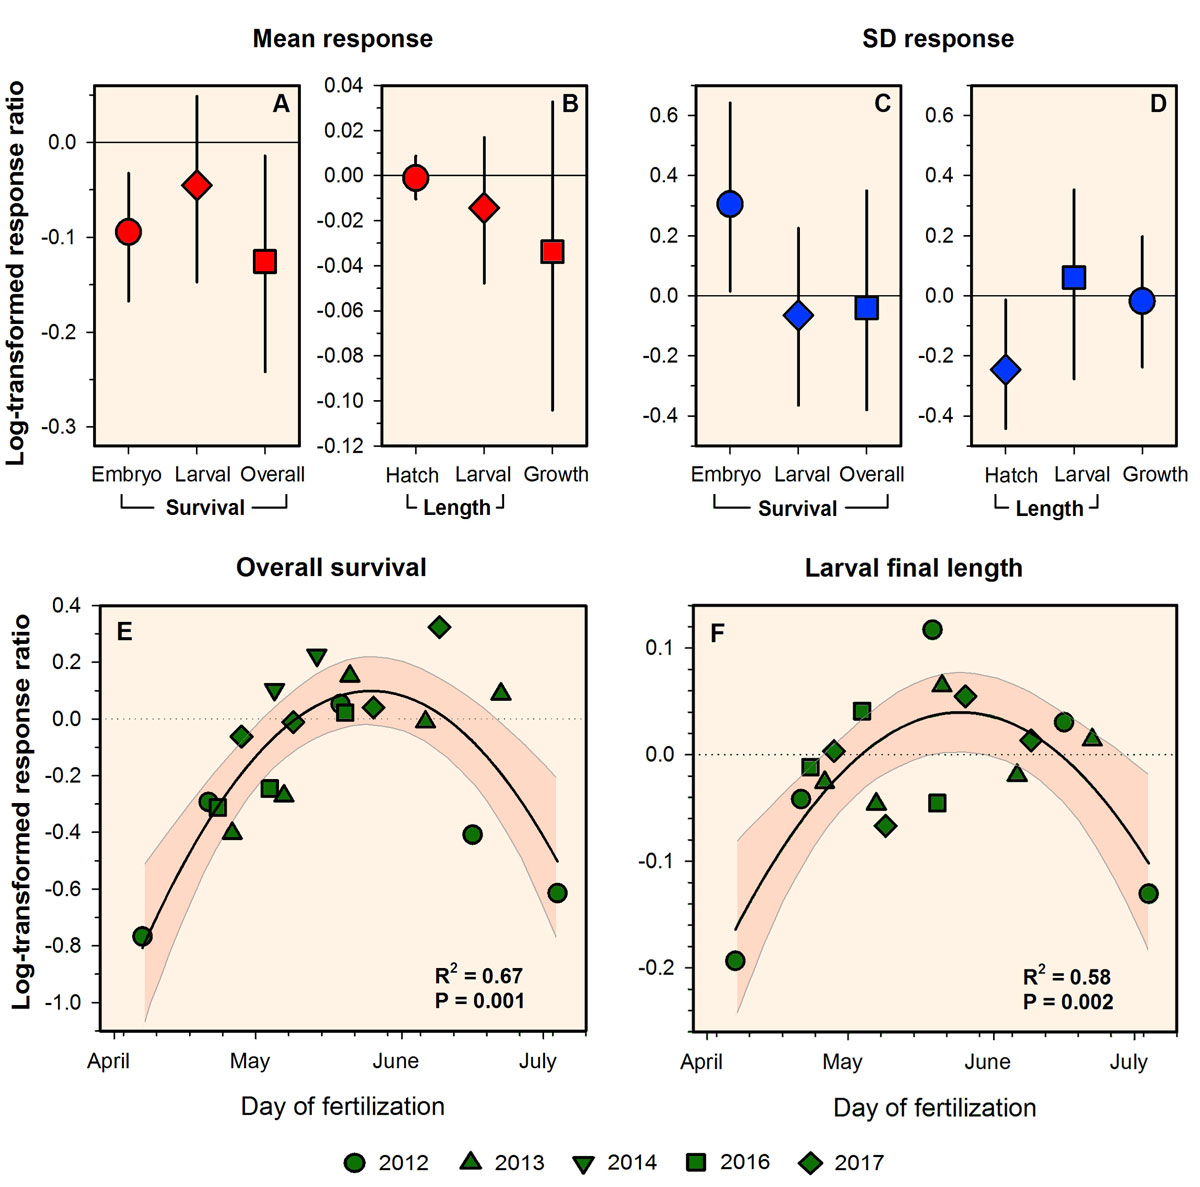
28 November 2018. Hannes, Emma, and Chris are happy to announce that Biology Letters just published our latest study, a meta-analysis of 20 standard CO2 exposure experiments conducted on Atlantic silverside offspring between 2012-2017. All these years of sustained experimental work resulted in the most robustly constrained estimates of overall CO2 effect sizes for a marine organism to date.
The study demonstrated:
A general tolerance of Atlantic silverside early life stages to pCO2 levels of ~2,000 µatm
A significant overall CO2 induced reduction of embryo and overall survival by -9% and -13%, respectively
The seasonal change in early life CO2 sensitivity in this species
The value of serial experimentation to detect and robustly estimate CO2 effects in marine organisms
This figure shows the summary of early life responses to high CO2 conditions in Atlantic silversides across all experiments conducted between 2012-2017. Effect size was estimated using the log-transformed response ratio (A-D). Error bars are 95% confidence intervals. The responses are considered significant if the confidence interval does not include zero. Panels E-F: seasonal decomposition of response ratios, showing that silverside early life stages are most sensitive to high CO2 at the beginning and end of their spawning season.
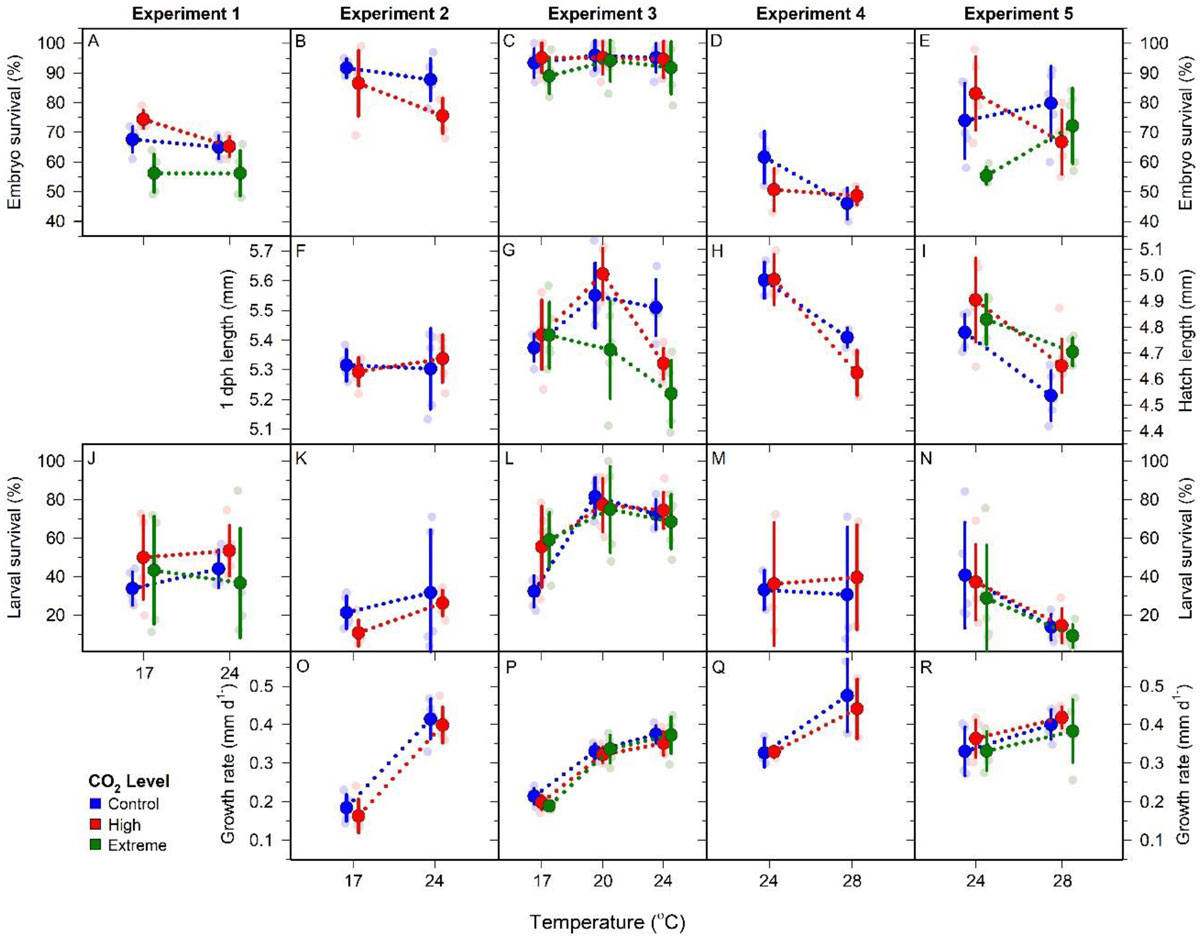
20 July 2018. We are happy to announce that Diversity just published Chris Murray’s paper on complex CO2 x temperature effects in Atlantic silverside offspring. The paper synthesizes 5 large multistressor experiments conducted since 2014, finding evidence for the large CO2 tolerance in this species across a large temperature range.
M. menidia. Offspring responses to control (blue), high (red), and extreme (green) CO2 conditions at four temperatures across five CO2 × temperature factorial experiments. Traits include embryo survival (A–E), hatch length (F–I), larval survival (J–N) and larval growth rate (O–R). Individual replicates are represented by small faded circles. Treatment means (±SD) are depicted by large, bold circles and connected by dotted lines. Note: different scales used for hatch length measurements due to differences in sample timing; panels F and G use 1dph length Y axis (left) while panels H and I use hatch length Y axis (right).
Holding the fort at the Rankin lab were Emma and Sydney, who did an excellent job. Thank you guys!
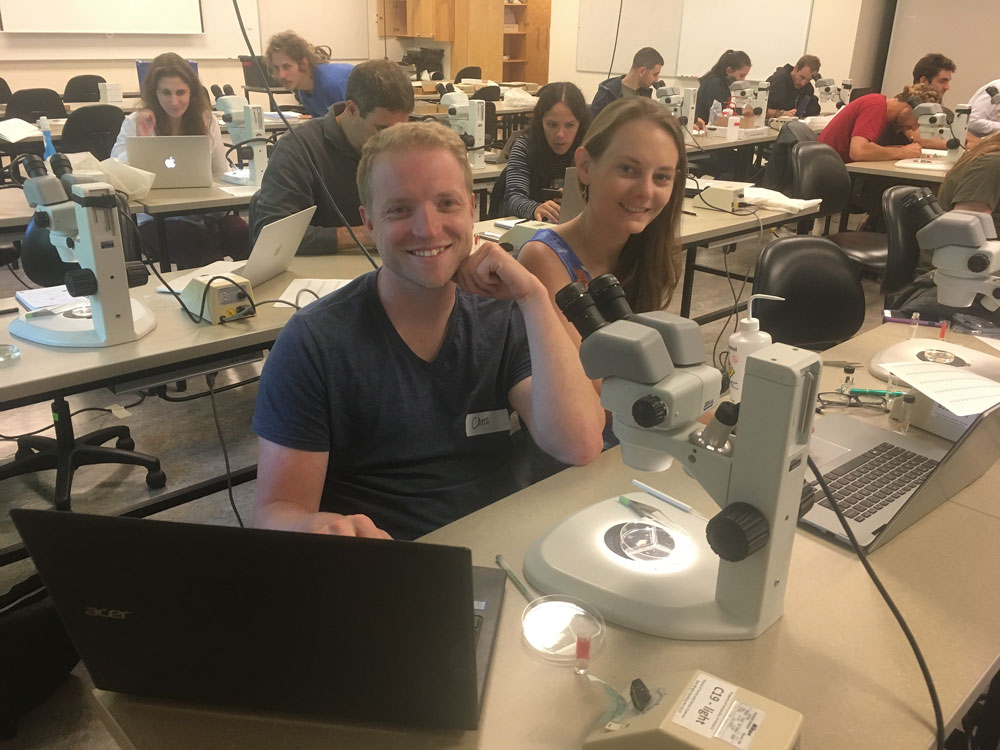
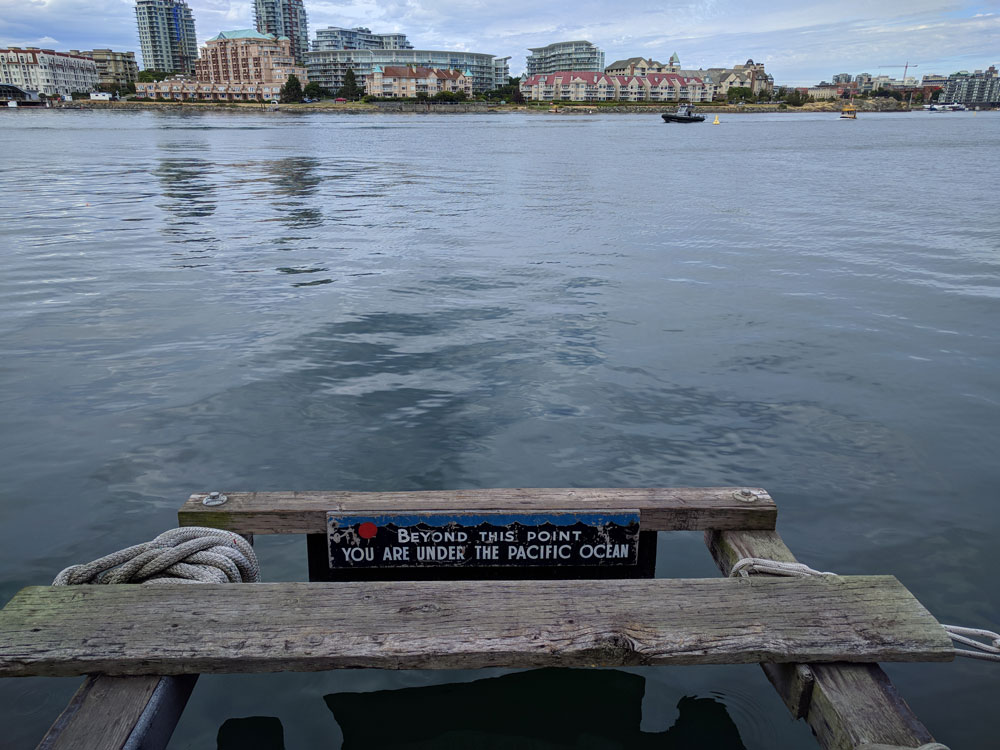
The Delta Victoria Ocean Pointe Resort was the conference venueBefore the conference, we all attended a workshop on larval fish identification
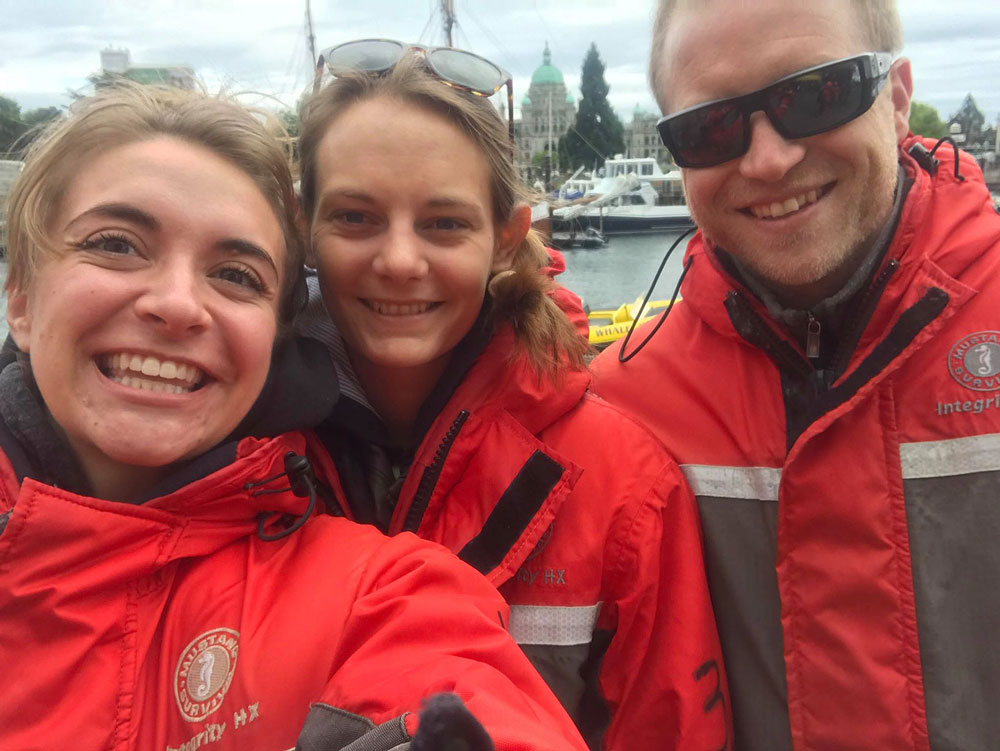
Whale-watching with Corinne, Julie & Chris
Here is how Julie experienced her first LFC:
Ever since attending the American Fisheries Society conference in 2014, I’ve wanted to go to another fish-focused conference. I was lucky enough to attend the 42nd annual Larval Fish Conference this year in Victoria, British Columbia, and it surpassed all my expectations. The week started off with a larval fish identification workshop where we got to learn techniques from renowned larval fish experts (and see some really cool fish larvae!). The talks were impressive and thought-provoking, providing many new ideas for research and how to give an engaging talk. My favorite part was meeting all the larval fish ecologists whose publications I’ve been reading for my thesis. I spent most of my evenings exploring Victoria with other grad students attending the conference and left with many new friends from institutes all over the world! The trip ended with a whale watch, where we saw a pod of 5 Orcas. Overall, the Larval Fish Conference was a great experience that I hope to someday attend again!
Oral presentations:
Pringle, J. and Baumann, H. Sex-specific growth and mortality patterns in juvenile Atlantic silversides (Menidia menidia) from Connecticut waters. Talk. 42nd Larval Fish Conference, Victoria, BC, Canada 24-28 June 2018
Murray, C.S., Wiley, D., and Baumann, H. Early life stages of the northern sand lance Ammodytes dubius show high sensitivity to acidification and warming in a CO2 × temperature factorial experiment. Talk. 42nd Larval Fish Conference, Victoria, BC, Canada 24-28 June 2018
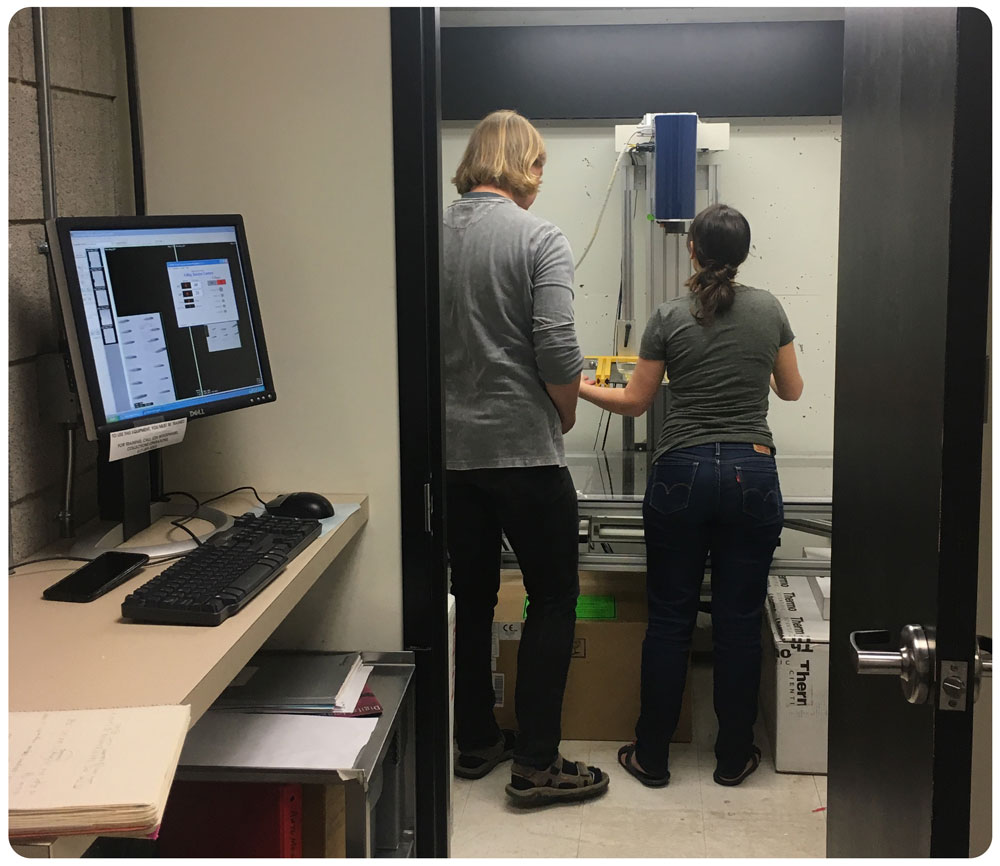
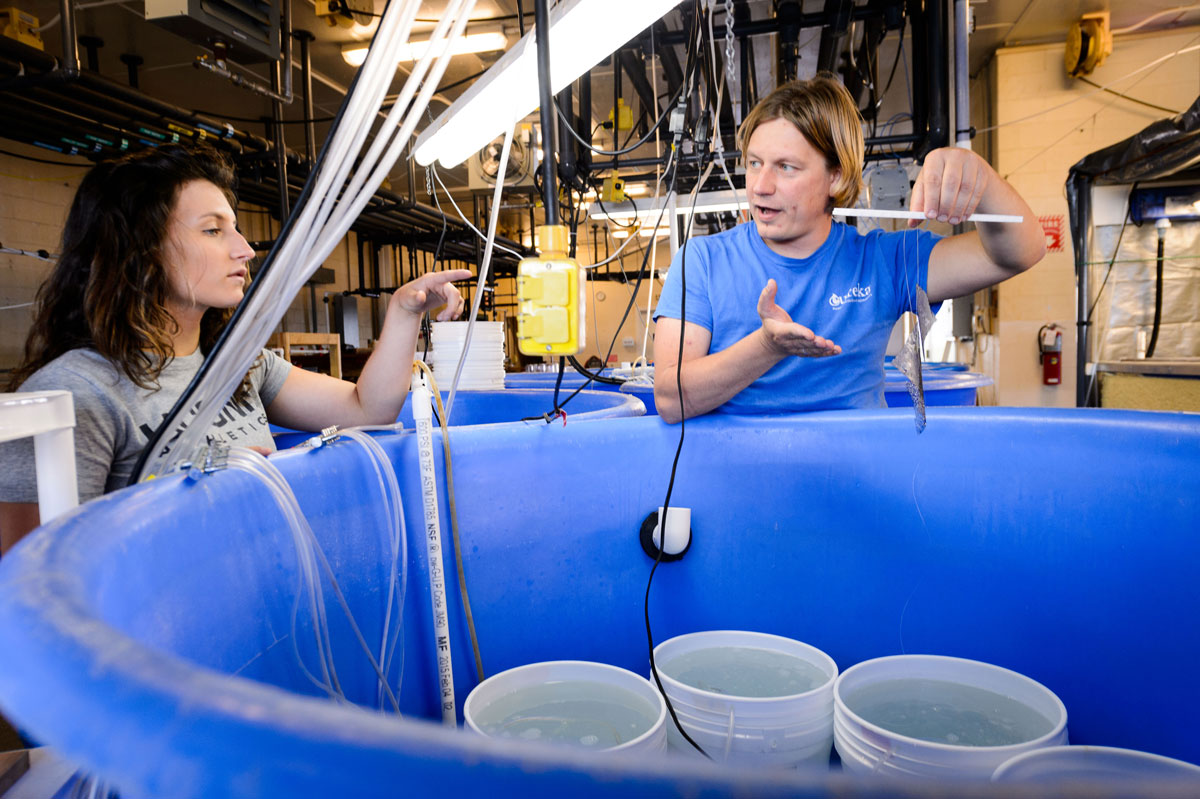
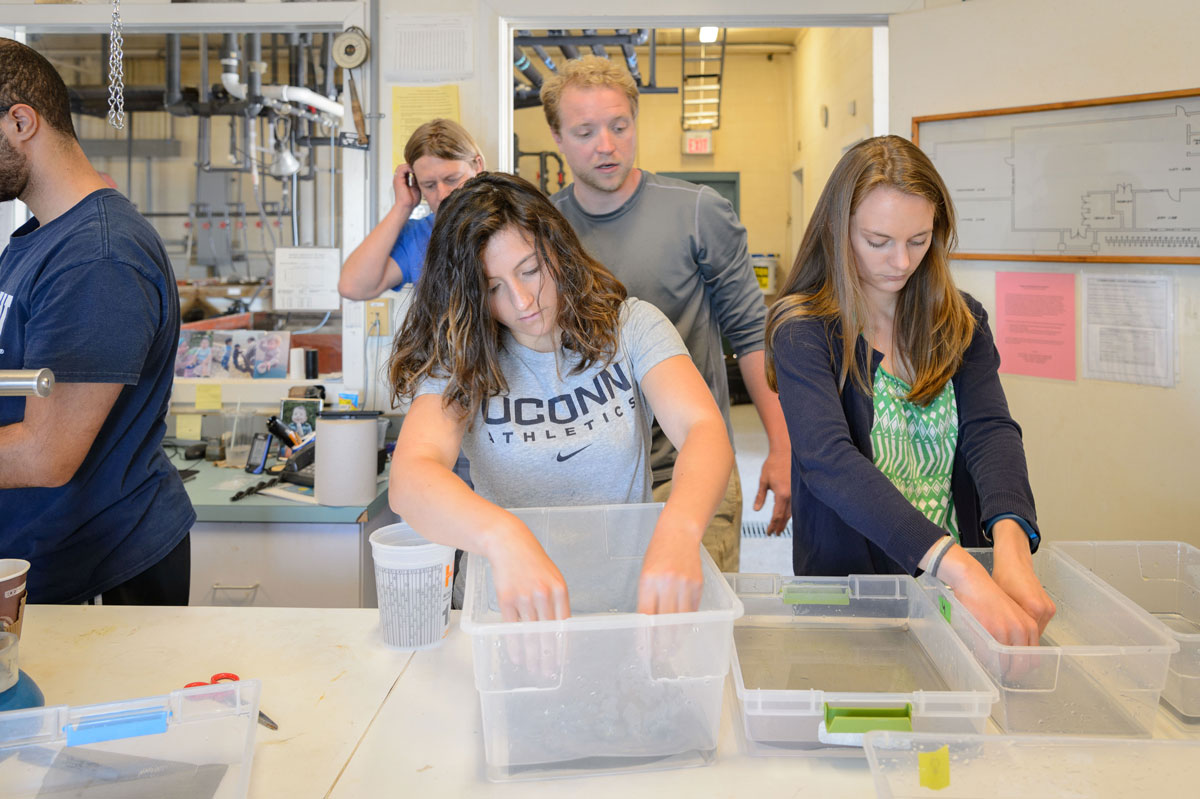
29 June 2018. A new experiment with Atlantic silversides (Menidia menidia) starts and as usual, it’s an all hand on deck operation. This time, we have Chris Tsang shadowing all of us and Emma professionally explaining the process.
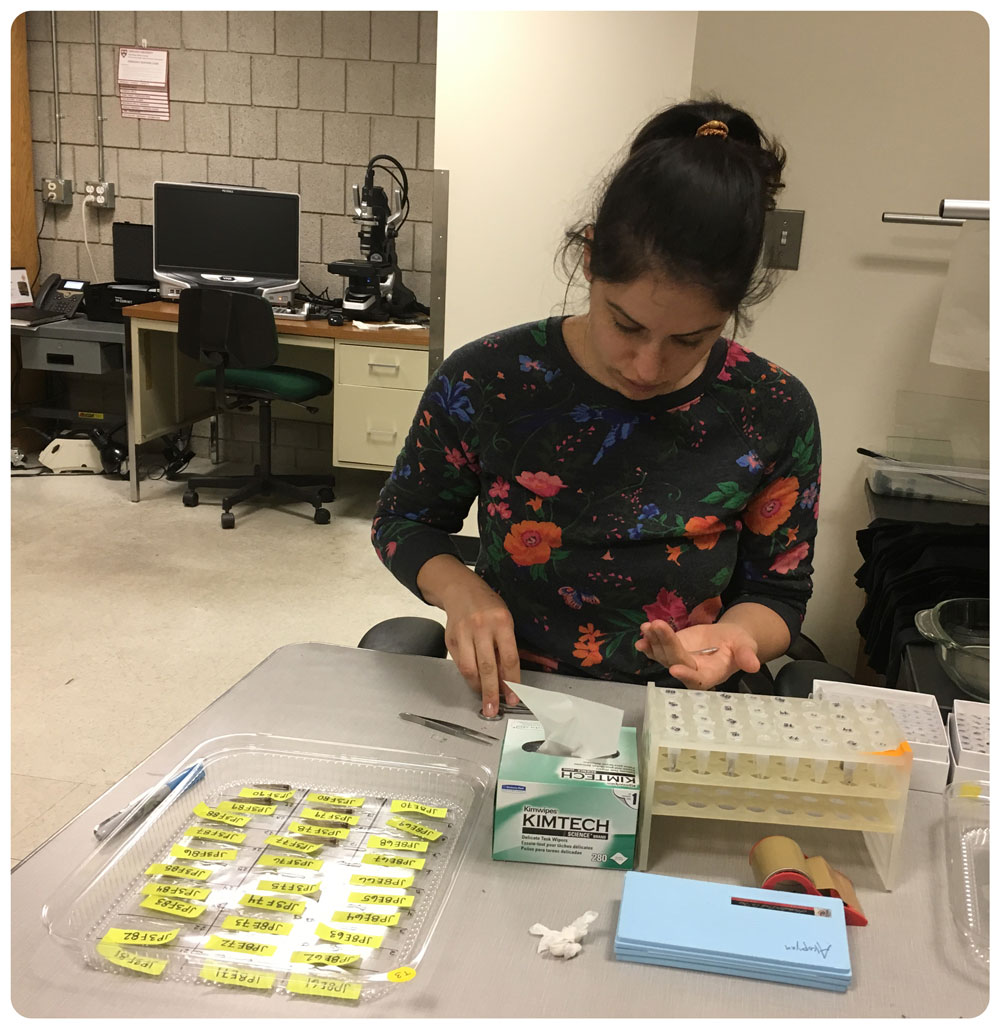
Friday, 8 June 2018. Hannes and Maria traveled to Boston’s Harvard University to meet with Valentina di Santo from the Lauder Lab at the Museum for Comparative Zoology. Thanks to our collaborators there, we were able to use a 2D-digital X-ray machine there, which we needed to complete the next big step in our Menidia Gene project.
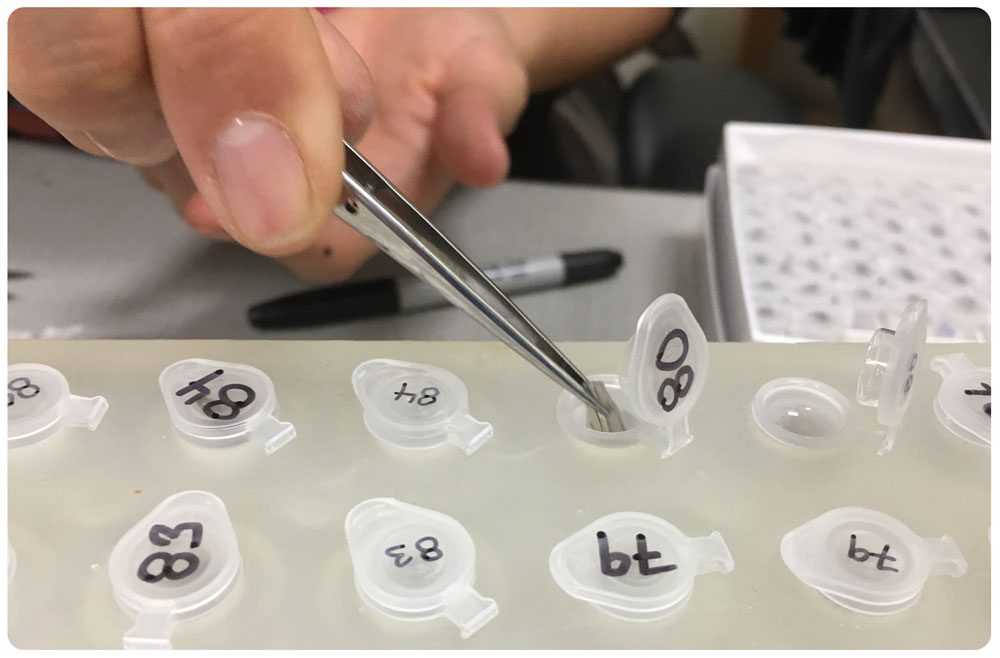
Genetic & body samples went in different vials
Maria Akopyan processing the fish after x-raying
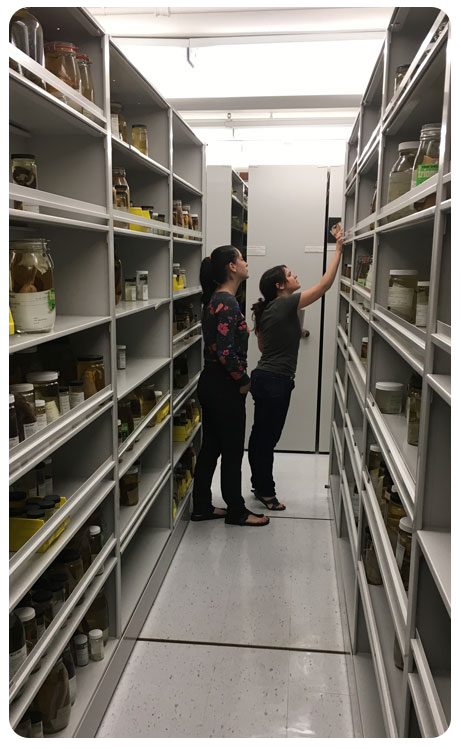
Maria and Valentina in the shark section of the collection
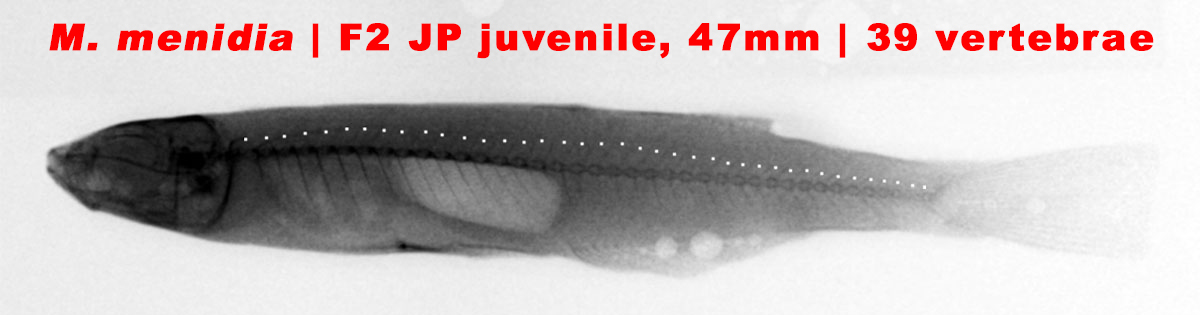
A few weeks ago, Maria had already measured each individual fish's length, weight, shape, routine metabolism, and maximum sustained swim speed. The next trait we're keen on mapping quantitatively to the silverside genome is the number of vertebrae, which we know increases in wild populations from south to north. What will our South/North hybrid F2 generation show?
At the Lauder lab, ‘lunch together’ is common thing
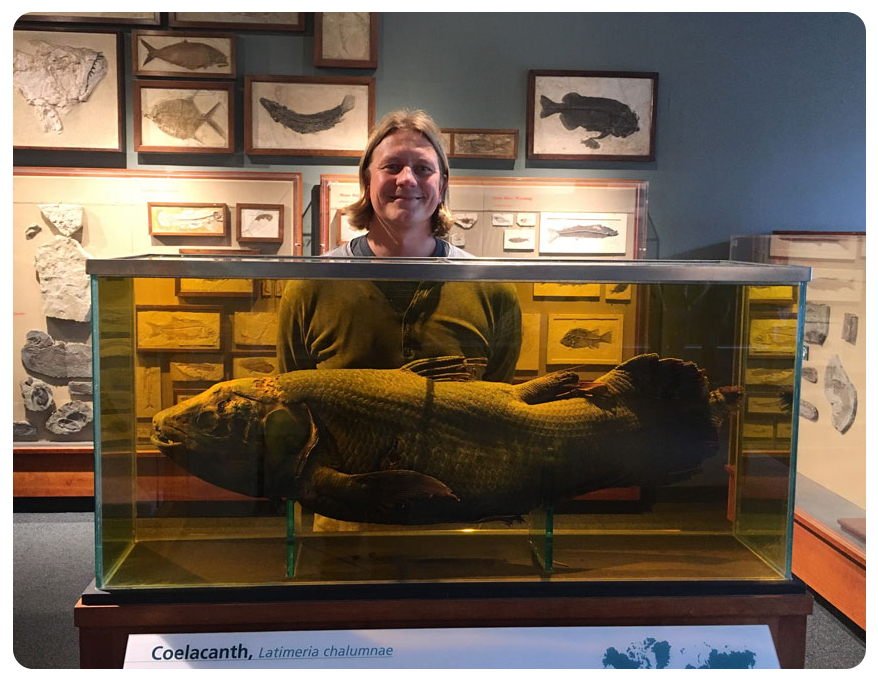
The famous Latimeria from the collection
Thanks to Valentina's excellent help, the work went without a hitch. At the end, we even had some spare time to enjoy the great atmosphere int the Lauder Lab during lunchtime, the tour through various lab installations, the experimental fish, and even the adjacent Harvard Zoological museum. Thank you all for the fun day at Harvard!
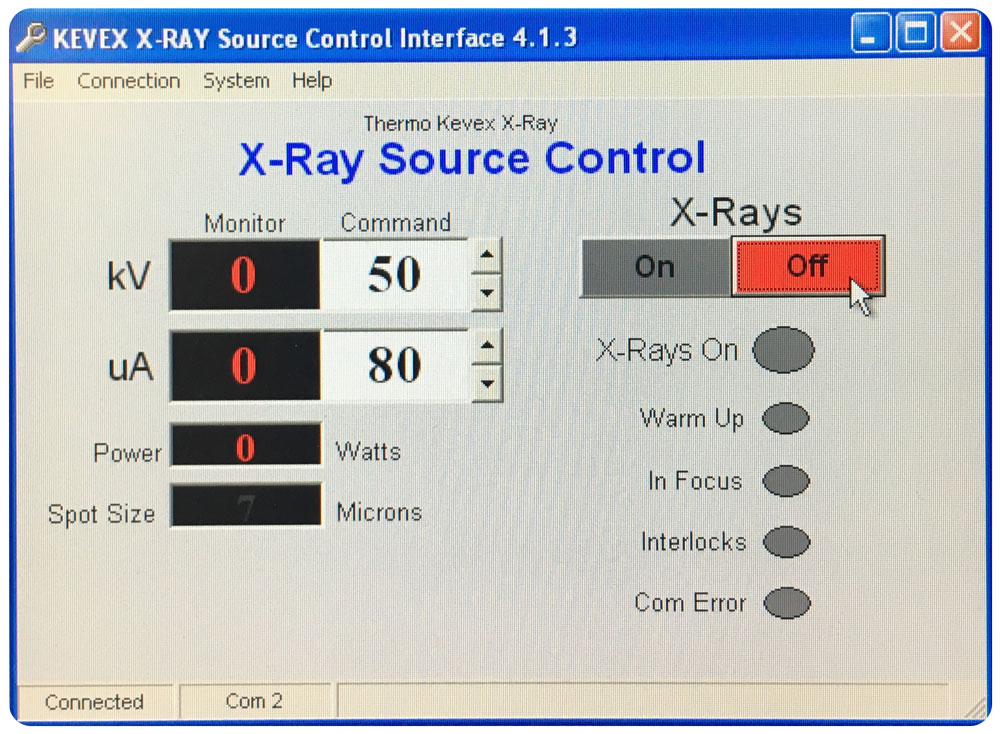
Settings used for x-raying juvenile silversides
Hannes and Valentina in the x-ray room
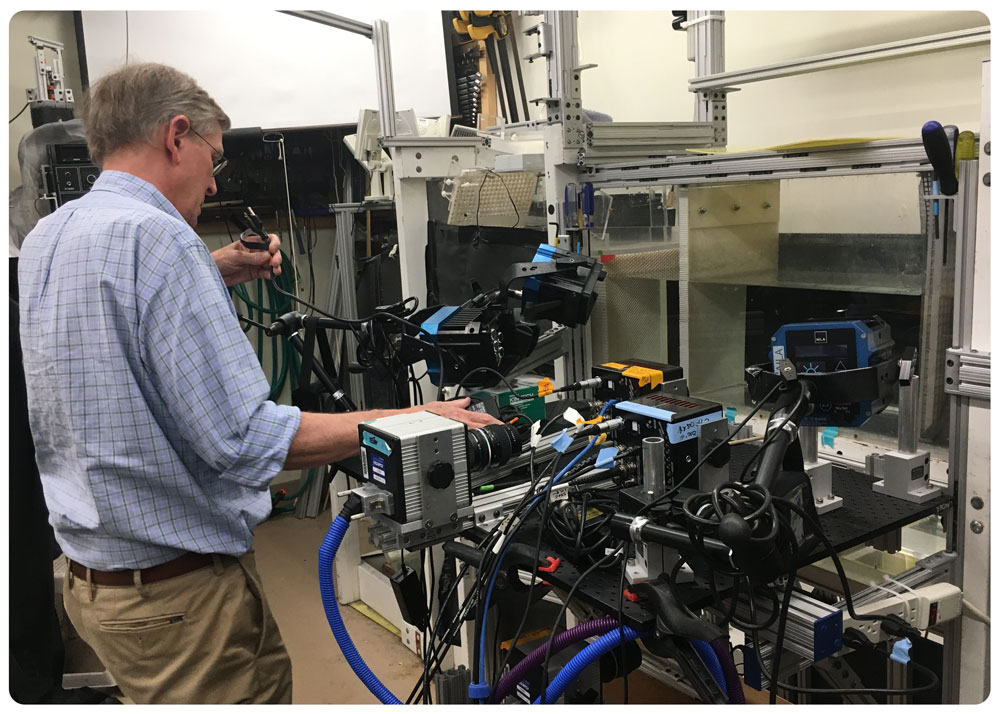
George Lauder adjusting equipment in the swim lab
The 282 fish are now split in a DNA sample for extraction and a body sample for further trait measurements.
On 18 May 2018, the Baumann lab teemed with activity. Maria Akopyan from Cornell University was busy phenotyping juvenile silversides for our Menidia Gene project. Mia and Mackenzie were busy working up field samples of silversides. And Hannes prepared adult silverside samples for later analyses.
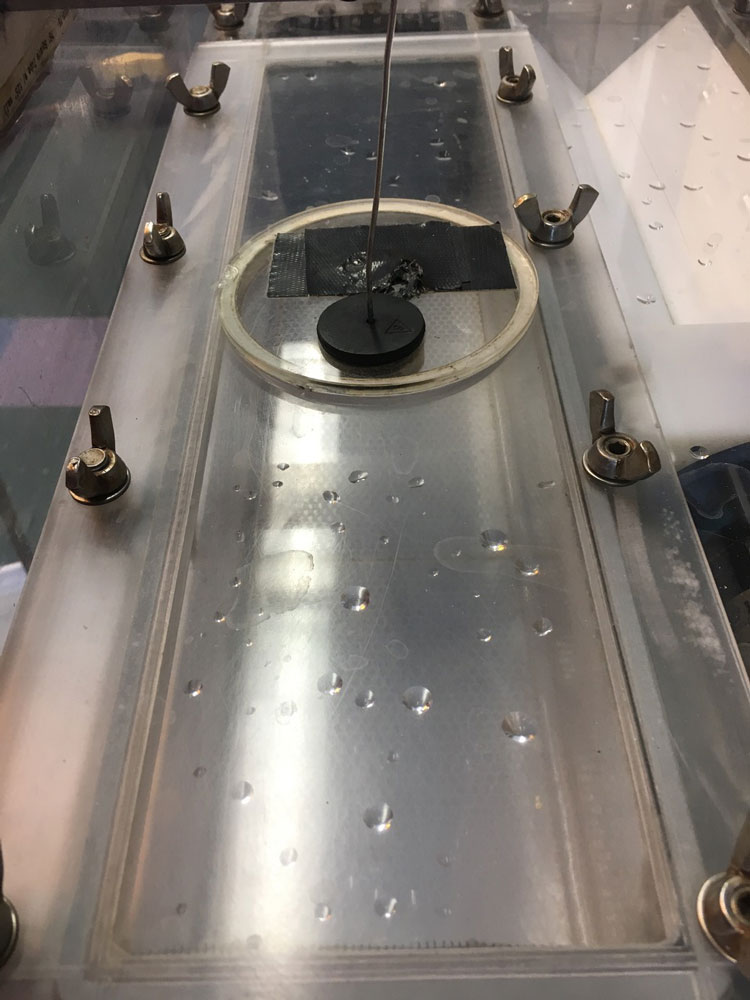
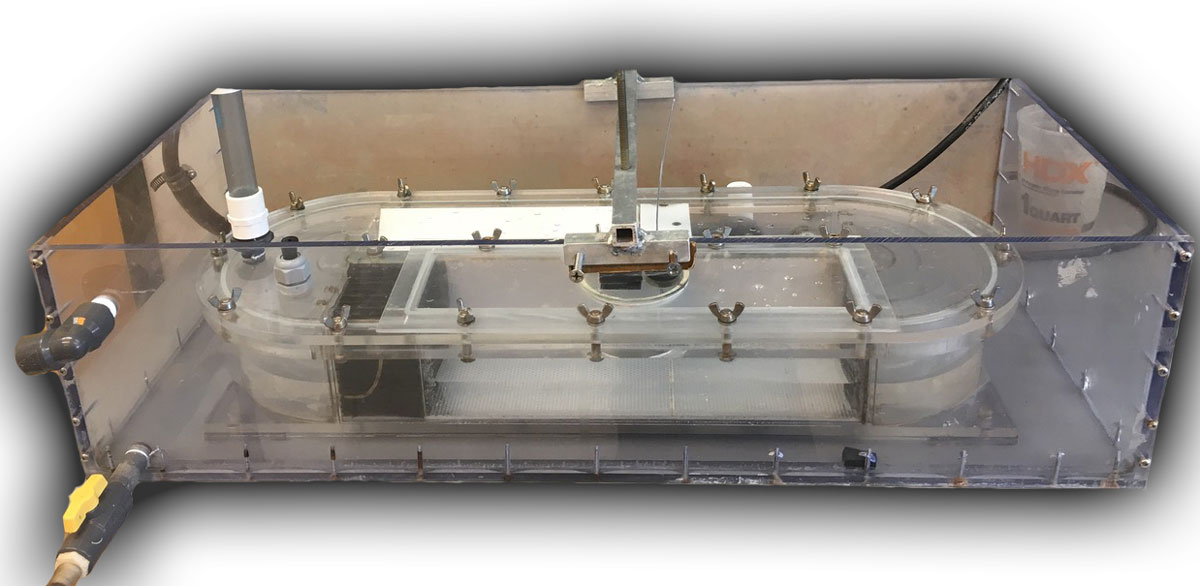
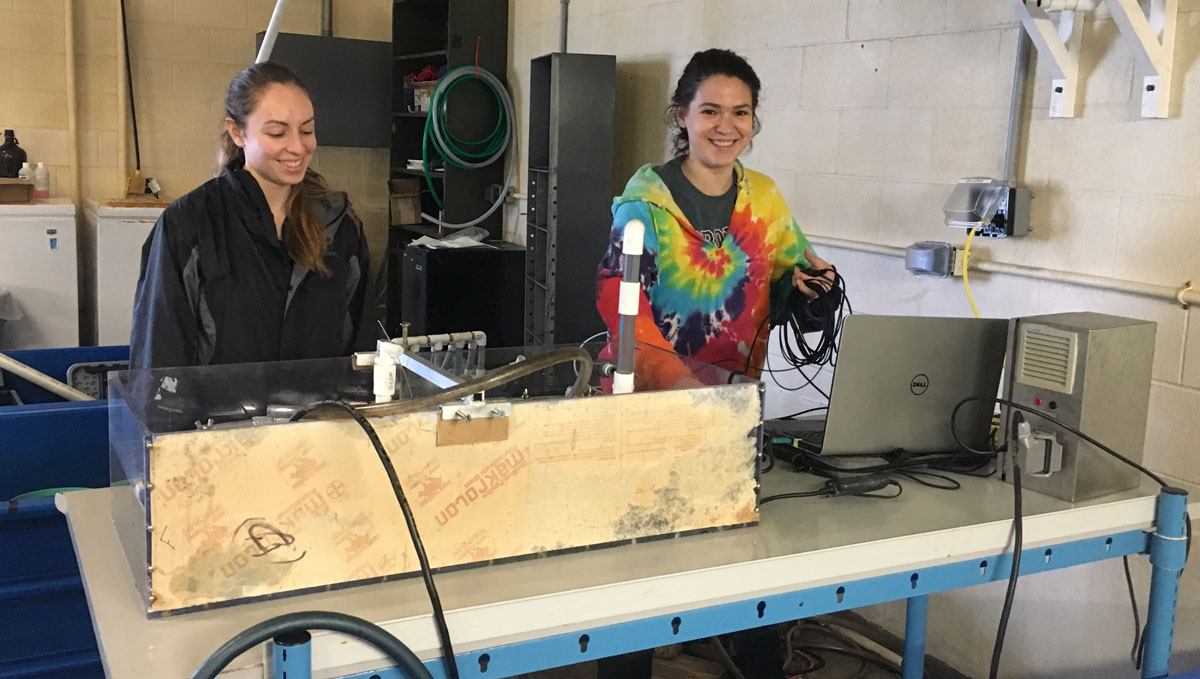
4 April 2018. Today, Adelle Molina and Teresa Schwemmer from the Nye Lab at Stony Brook University visited us with a bunch of respirometry equipment in tow. We were trying to find out how to measure critical swimming speeds and oxygen consumption on individual silverside juveniles. This information, along with other individual traits such as growth, lipid content, and vertebral number will later be used in our new NSF-project examining the genetic underpinnings of local adaptation in this species.
One crucial piece of equipment to do this work is a swimming chamber, also called swim flume. The one we will use is almost 20 years old and has already been used for silverside work more than a decade ago. After a long odyssey through several labs and institutions in the US, we finally got hold of it again, gave it some serious TLC and now hope to resurrect it. Thanks to our pro’s from Stony Brook, the first tests were promising today! Thank you Adelle and Teresa.
A ~ 3 cm juvenile silverside swimming against the induced current in the swim tunnel
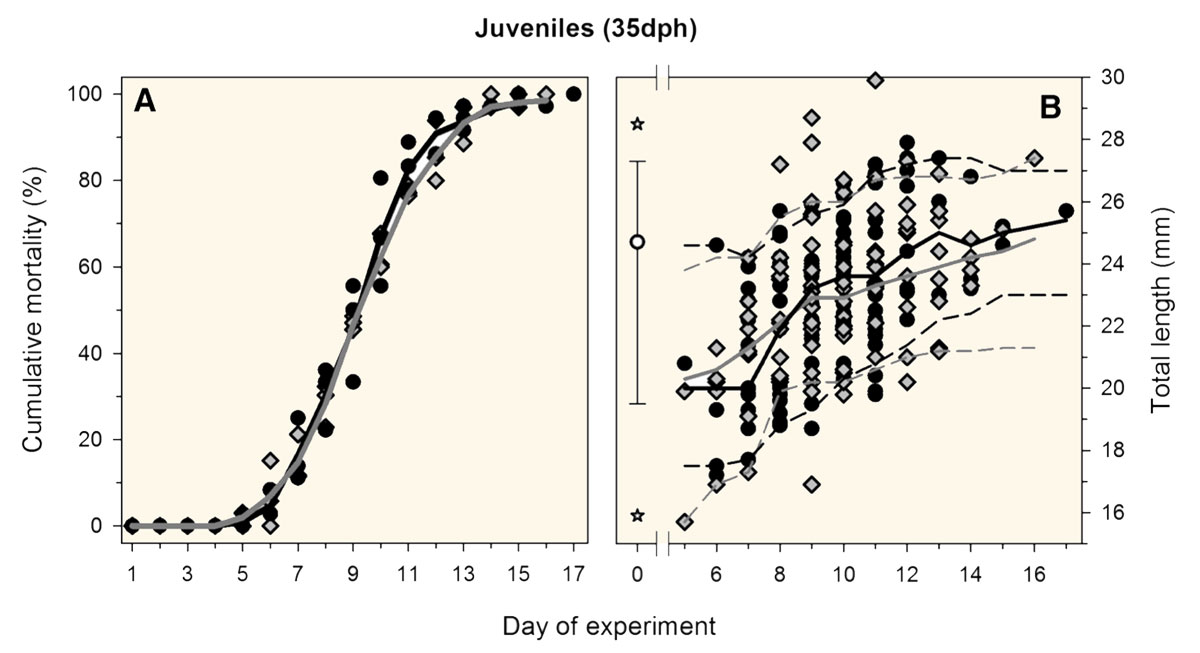
31 March 2018. We’re happy to announce that Marine Biology just published our latest study examining the starvation tolerance of silverside larvae and juveniles at contrasting CO2 conditions. We compiled observations from five separate experiments spanning different years, laboratories, temperatures, life stages, and CO2 levels. Contrary to expectation, we found that starvation rates were largely independent of the CO2 environment in this fish species.
One major set of data was produced by Elle Parks as part of her Research Experience for Undergraduates (NSF-REU) in summer 2017. Well done, everybody!
Baumann, H., Parks, E.M.*, and Murray, C.S.* (2018)
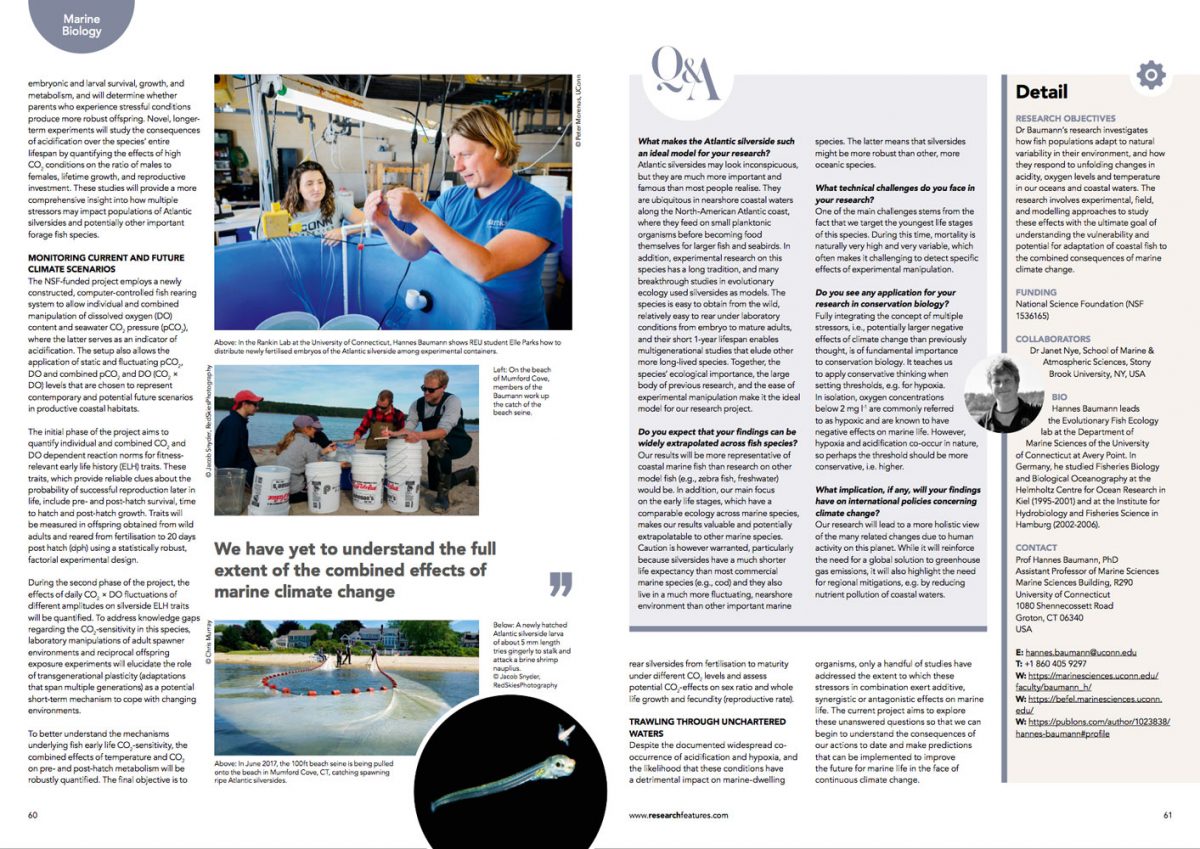
Hannes shows Elle Parks (REU 2017), how individual screen with enumerated embryos are suspended into the replicate rearing containers. (Photo: Peter Morenus, UConn)
On 9 June, Elle and Julie strip-spawn Atlantic silverside females into spawning dishes covered in window screen for eggs to attach. (Photo: Peter Morenus, UConn)
M. menidia. (A) Relative cumulative starvation mortalities of early juveniles reared under ambient (grey line, diamonds) vs. high CO2 conditions (black line, circles). Symbols depict individual replicates, lines represent treatment means. (B) Total length of juveniles perishing during the experiment at ambient (grey diamonds) vs. high CO2 conditions (black circles). Lines represent the median(solid lines), 5th and 95th percentiles (dashed lines) of TL estimated with locally weighted, non-parametric density estimators. The initial TL distribution at the beginning of the experiment is depicted on day 0 as the median (white circle), 5th/95th percentiles (whiskers) and the minimum and maximum (white stars).
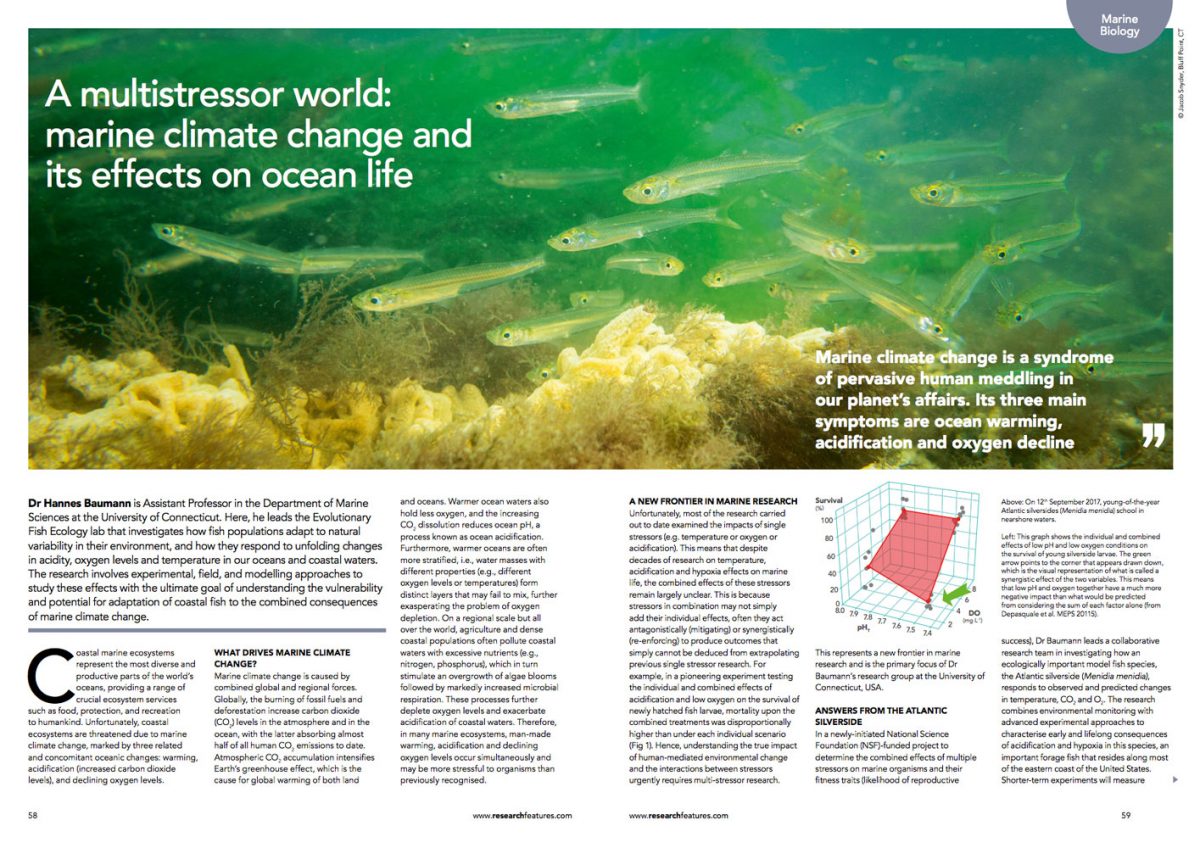
This research feature makes the case for multistressor research to a broad general audience and introduces our NSF project and its participants. Download the feature by clicking on the pictures or the link below.
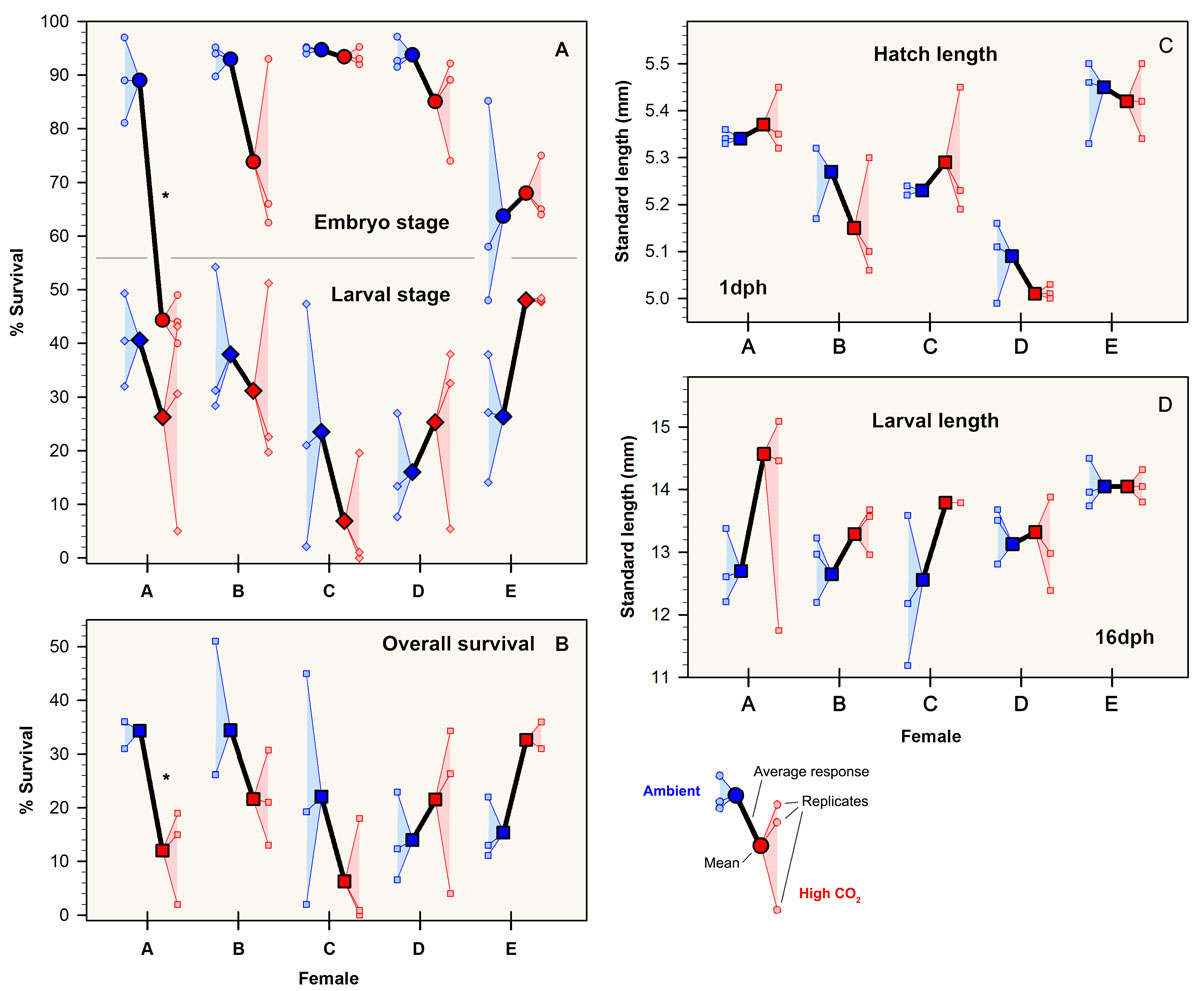
28 November 2017. The Journal of Experimental Marine Biology and Ecology just published the latest study by our group looking at differences in the CO2 sensitivity of Atlantic silverside offspring stemming from different mothers. Congratulations to Jacob Snyder for his first peer-reviewed publication.
Among the highlights of the study:
Offspring produced by different females varied in their sensitivity to high CO2 conditions.
Specific fatty acids in eggs were correlated to the log-transformed CO2 response ratio of embryo survival and hatch length.
Maternal provisioning might be an additional determinant of CO2 sensitivity in fish early life stages.
M. menidia. Responses to high CO2 conditions among replicates within and among females: (A) embryo and larval survival; (B) overall survival; (C) SL at hatch; and (D) final SL (16 dph). Patterns of larval growth were nearly identical to panel D and are therefore omitted. Ambient and high CO2 treatments are denoted by red and blue colors, respectively. Small symbols depict replicate survival (A,B) or replicate average size (C,D), while large symbols depict CO2 treatment averages for each female. Black lines connect average response for each female. Asterisks represent significant differences (P < 0.05) between CO2 levels within offspring of each female (Bonferroni adjusted t-test). Letters denote to females A to E.